Companion data

Spatial transferability of explainable machine learning for predicting pre-treatment tuberculosis loss to follow-up across districts and cities in West Java, Indonesia

At a glance

Headline quantities from the study cohort and the transportable model.

Predictor value details

The article reports predictor importance and refers the reader here for the value-level detail. For each predictor the table gives the number of patients, the observed pre-treatment loss rate, and the odds ratio adjusted for the other predictors with a 95 % confidence interval. This is the one part of the analysis that has no figure in the article, because the detail is the point.
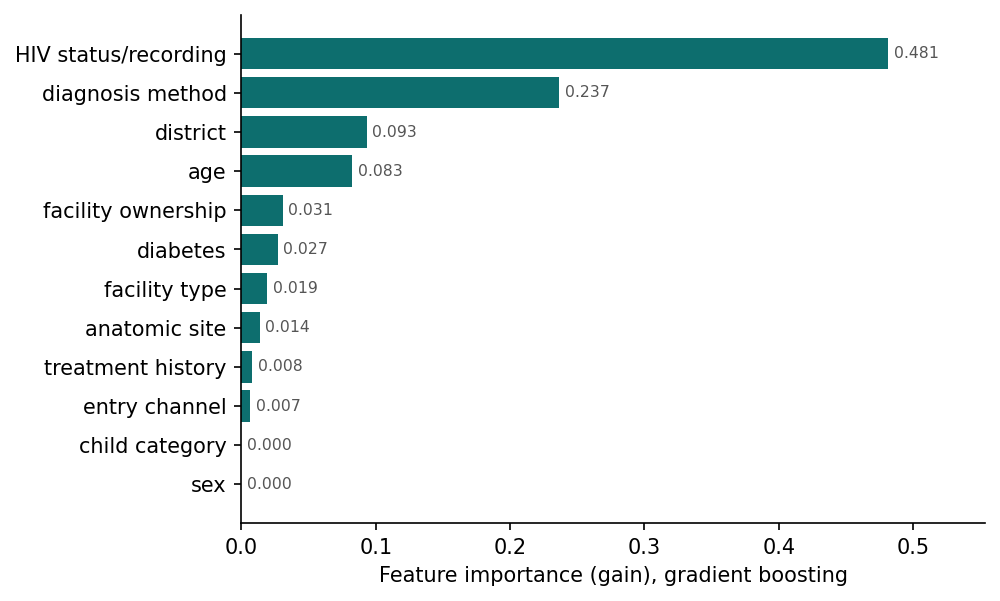
Predictor importance by gradient boosting gain
Figure 6. Importance of all pre-treatment loss predictors according to gradient boosting gain importance.
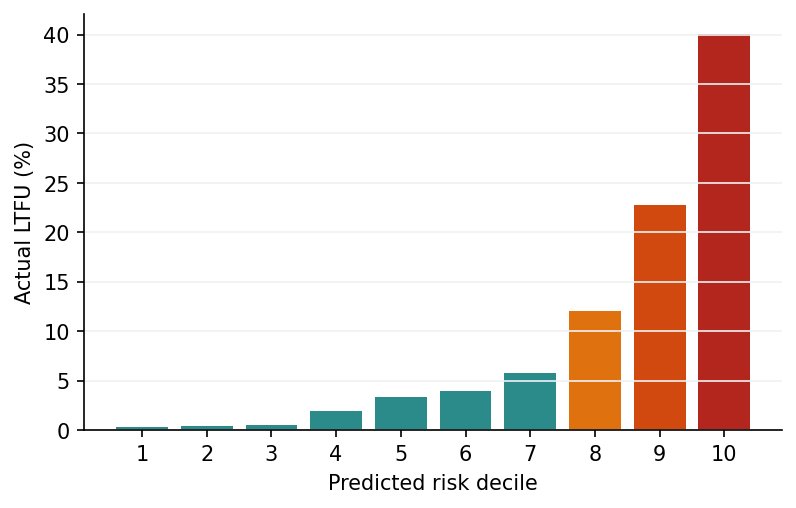
Actual loss rate per decile of prediction score
Figure 7. Risk stratification: actual loss rate per decile of prediction score.

Transferability by district and city

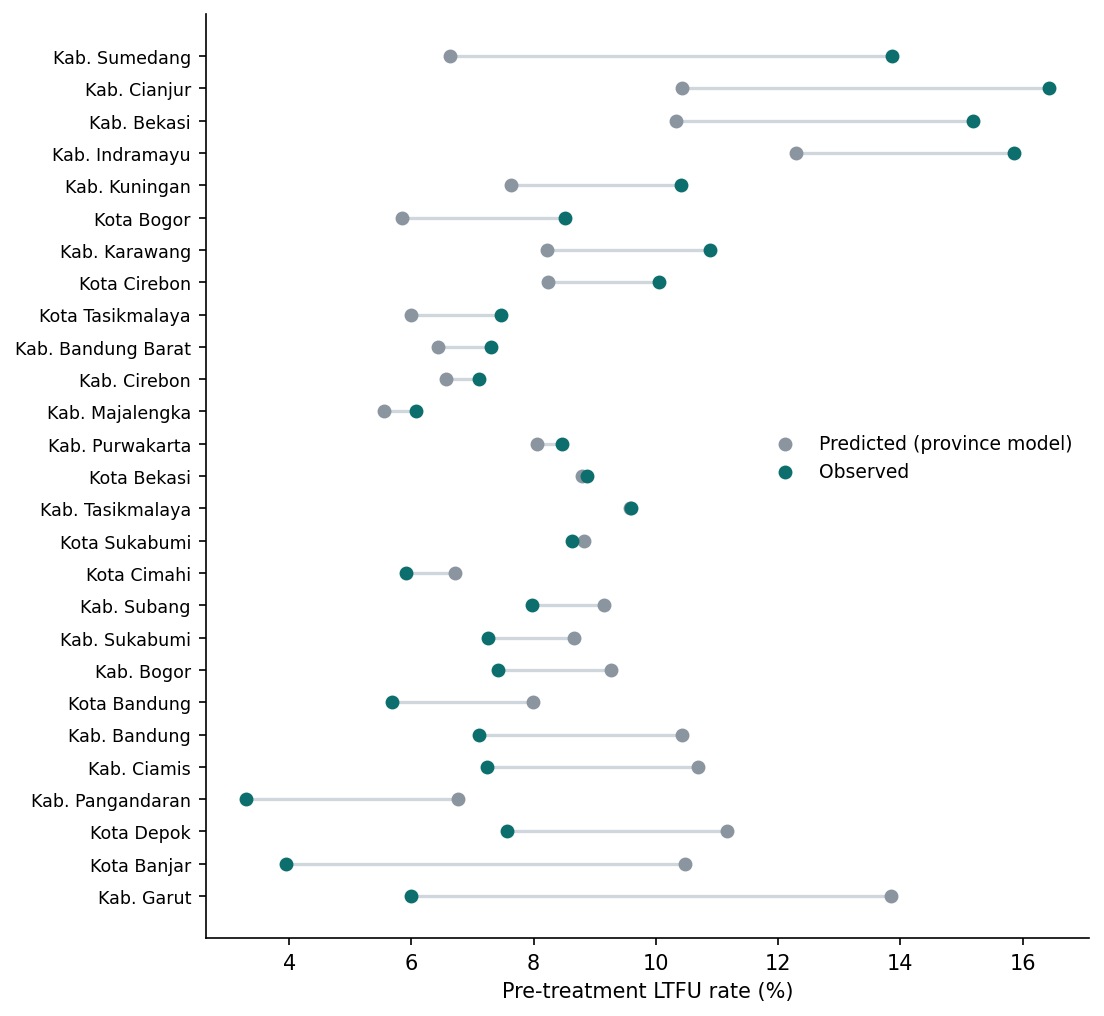
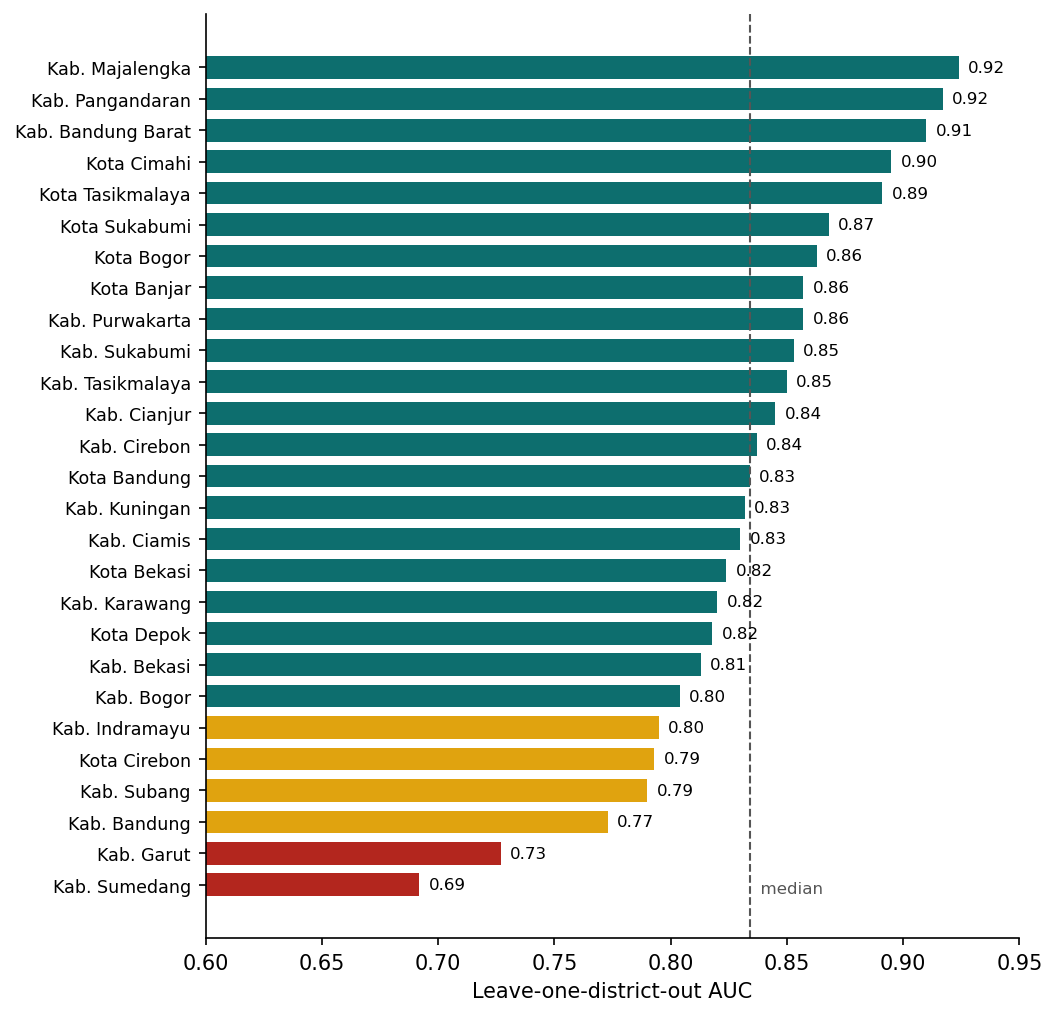
Leave-one-district-out results for the transportable model: trained on 26 areas, tested on the one held out. Colour on the map is the observed rate minus the predicted rate, so red means the provincial model under-estimates risk there; hatching marks weak discrimination.
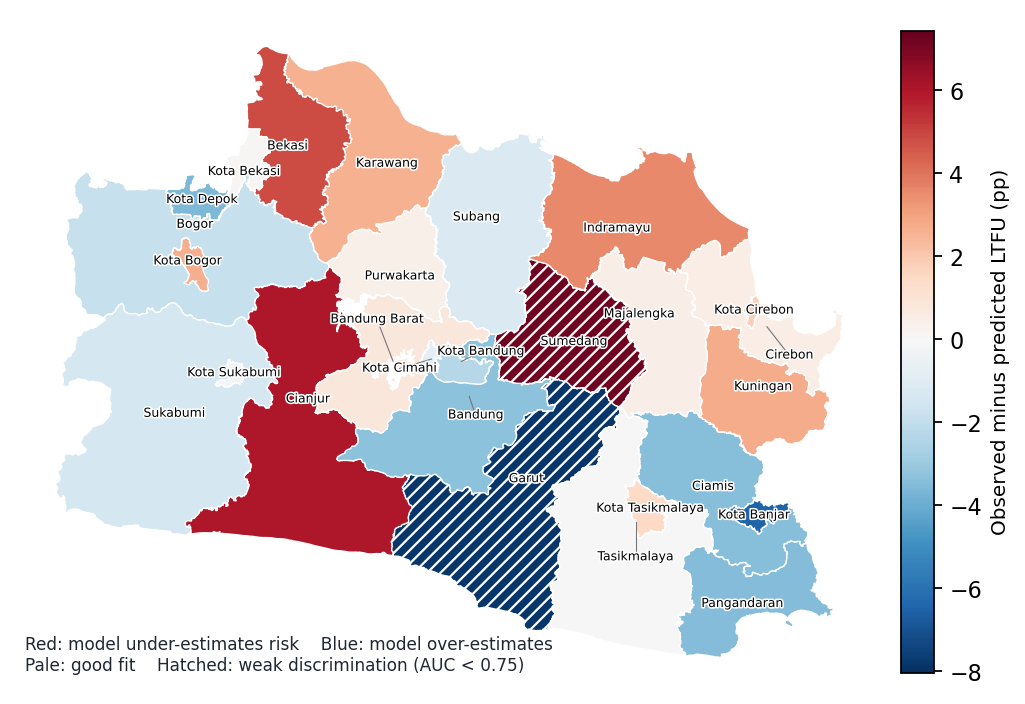
Map of transportable model fit per district and city
Figure 13. Map of transportable model fit per district and city.
Leave-one-district-out AUC per district and city
Figure 15. Leave-one-district-out AUC per district and city.
Cross-area calibration, observed versus mean predicted risk
Figure 14. Cross-area calibration: observed loss rate versus mean predicted risk.
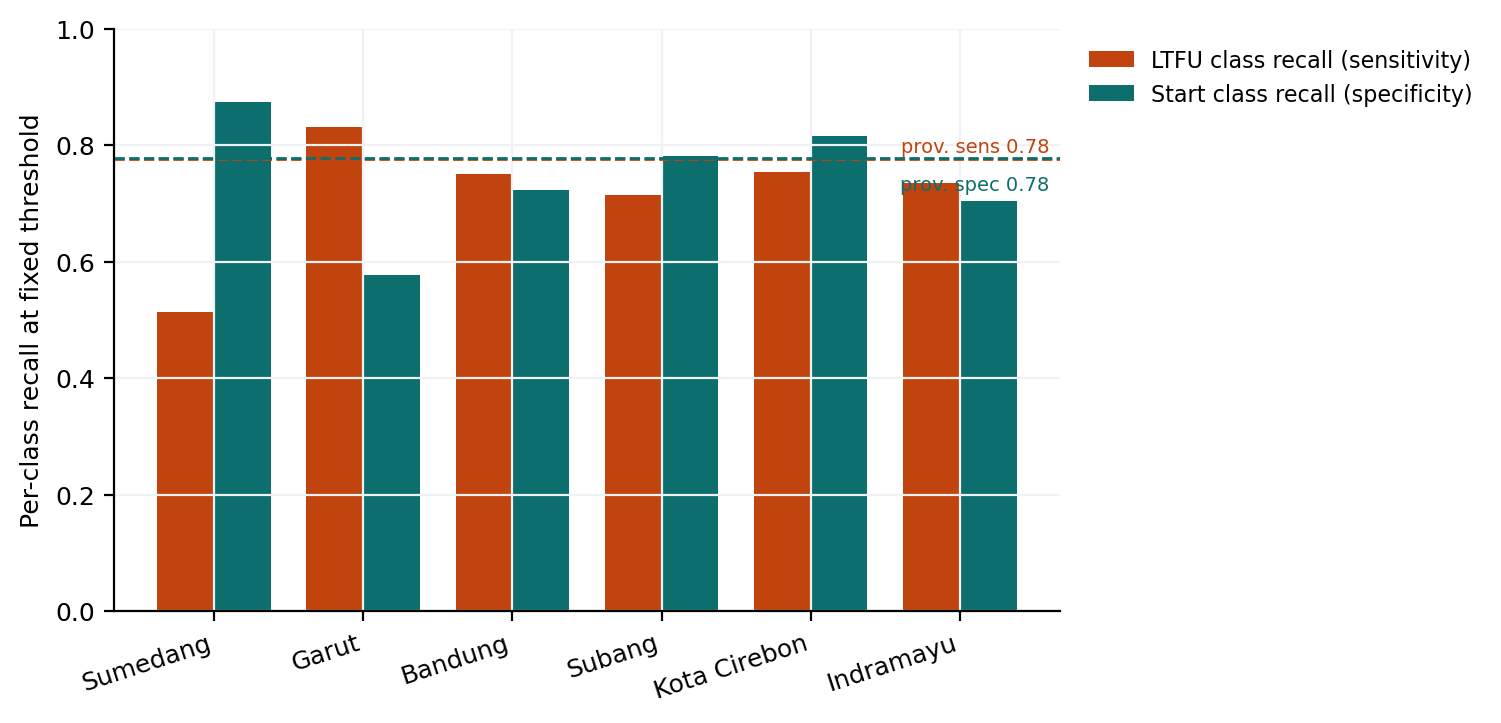
Per-class recall in the six lowest-AUC areas
Figure 16. Per-class recall in the six lowest-AUC areas: which class the model actually fails to predict.

Area risk after case mix is equalised

From the development model, which includes district of residence. Reference category is Kabupaten Bogor.
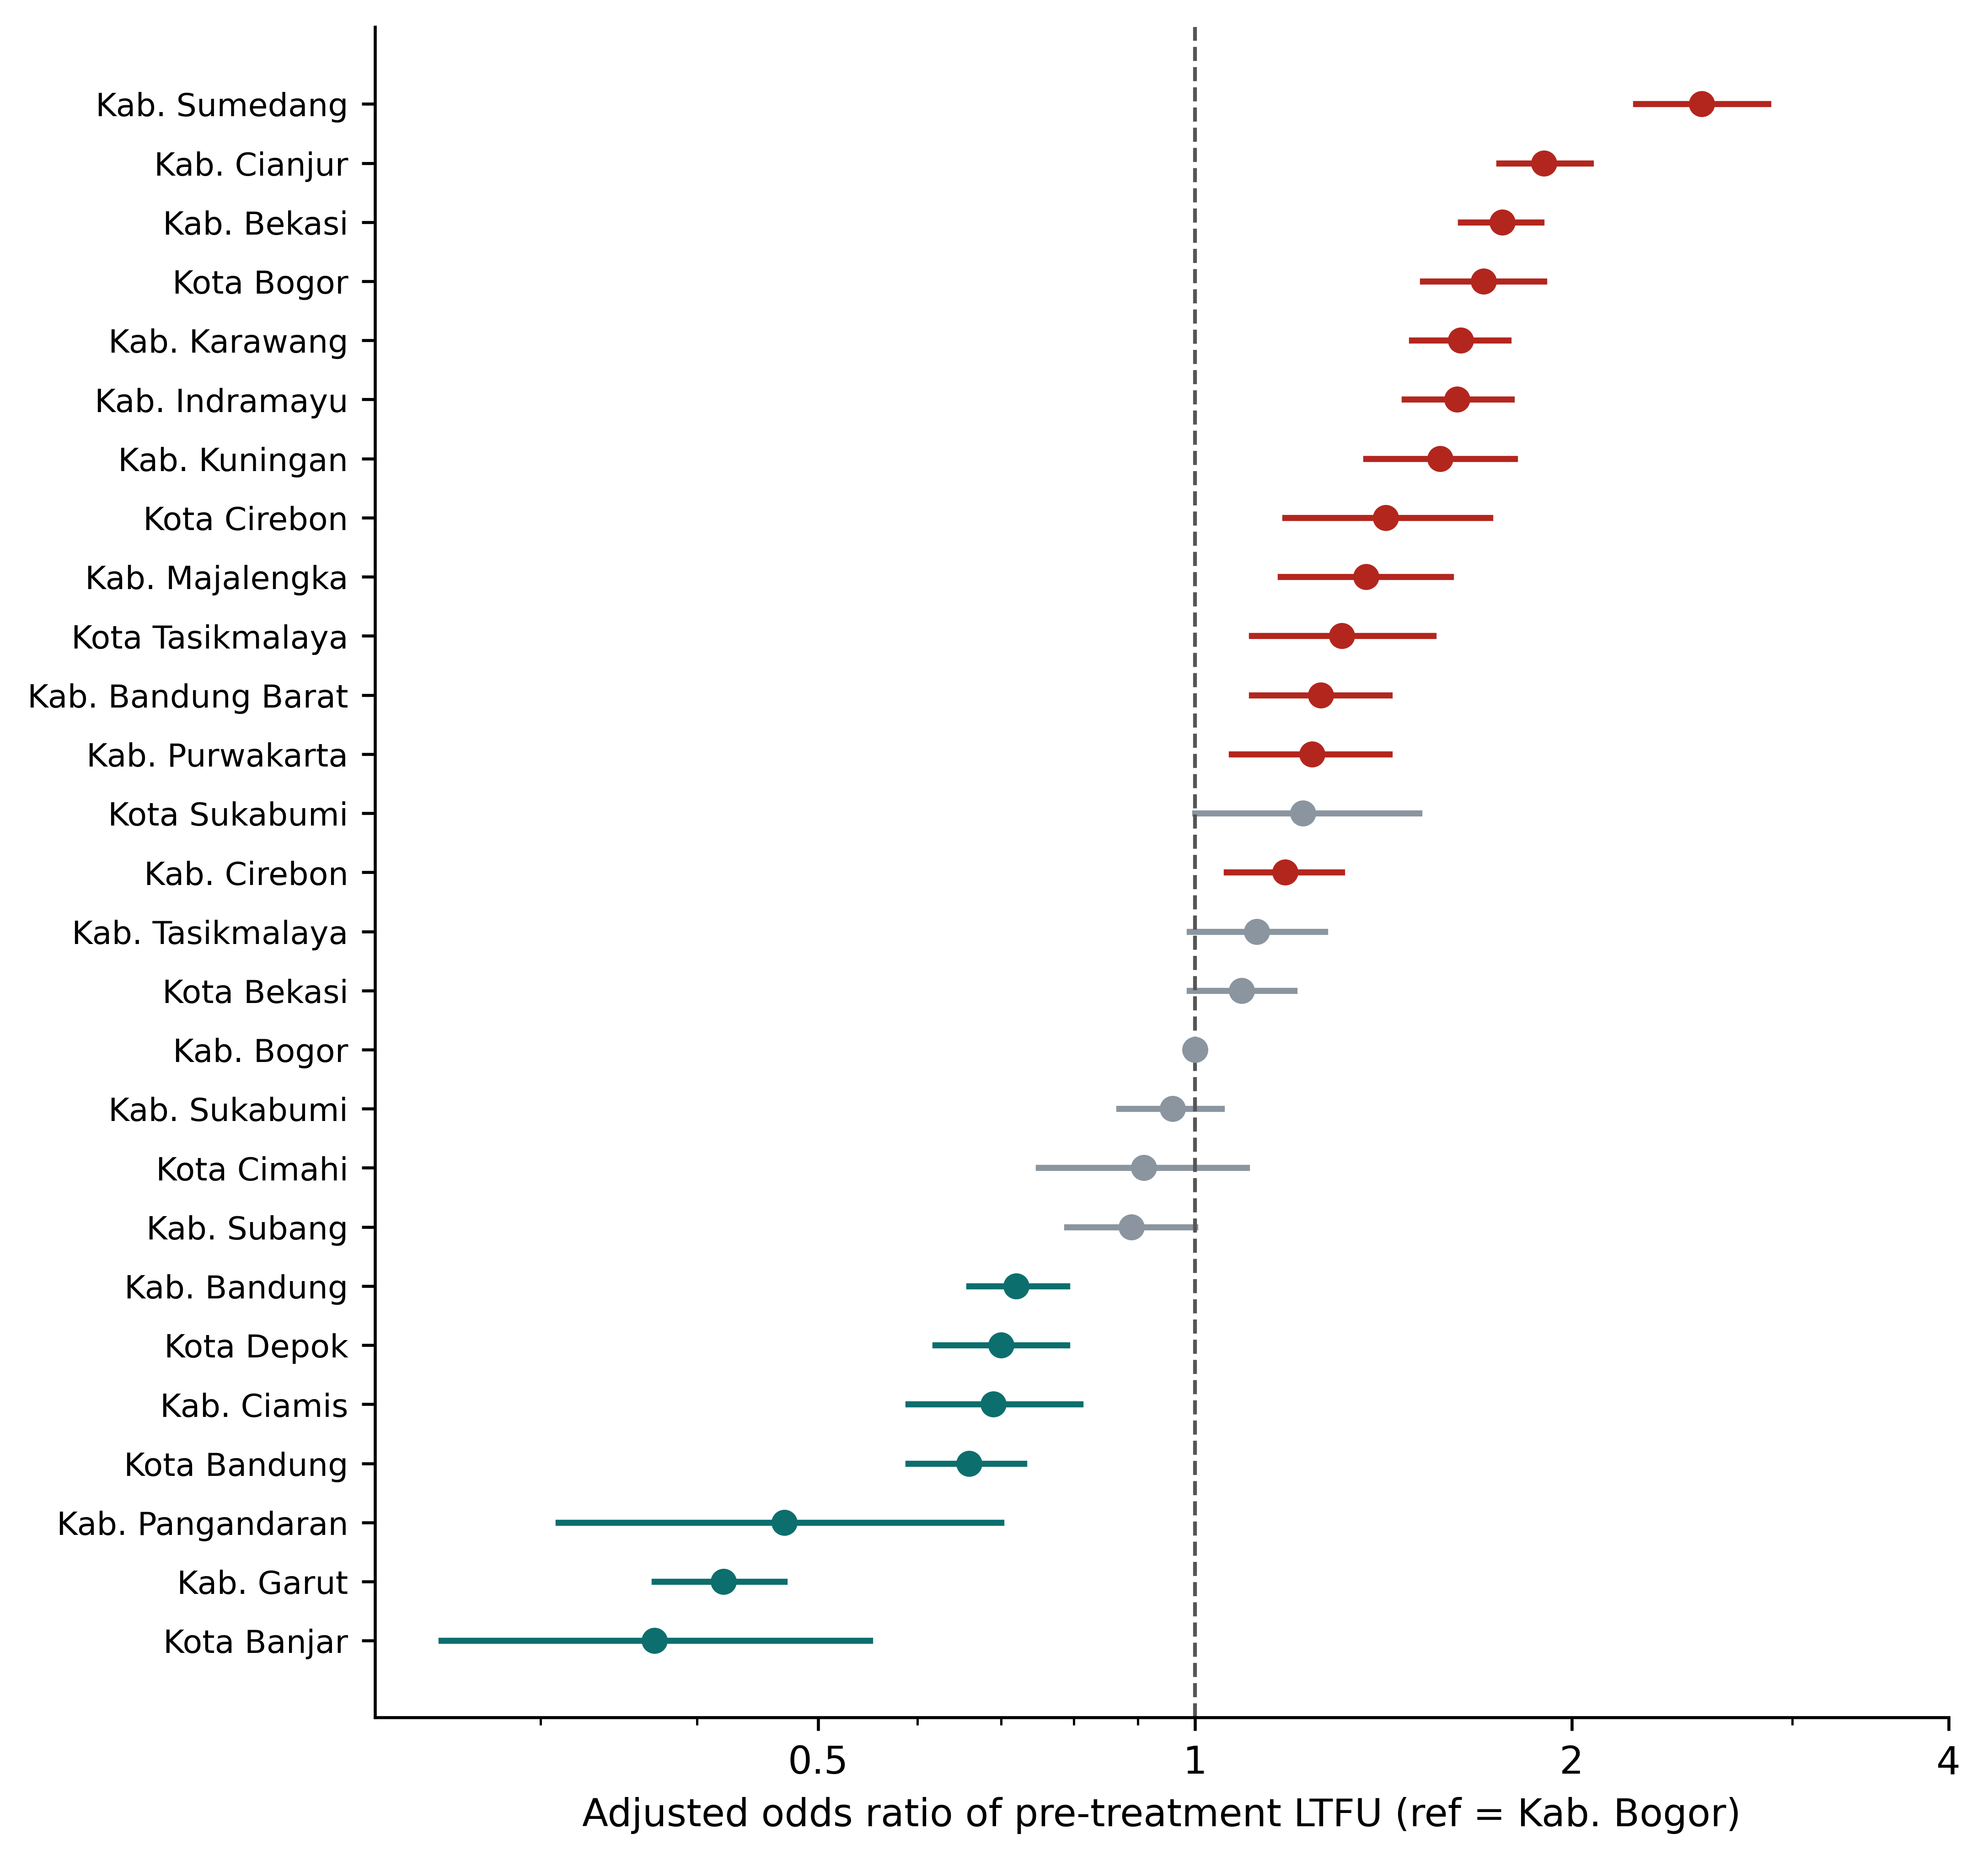
Adjusted odds ratio of pre-treatment loss per district and city
Figure 9. Adjusted odds ratio per district and city with 95 percent confidence interval, reference Kabupaten Bogor.

Model comparison and calibration

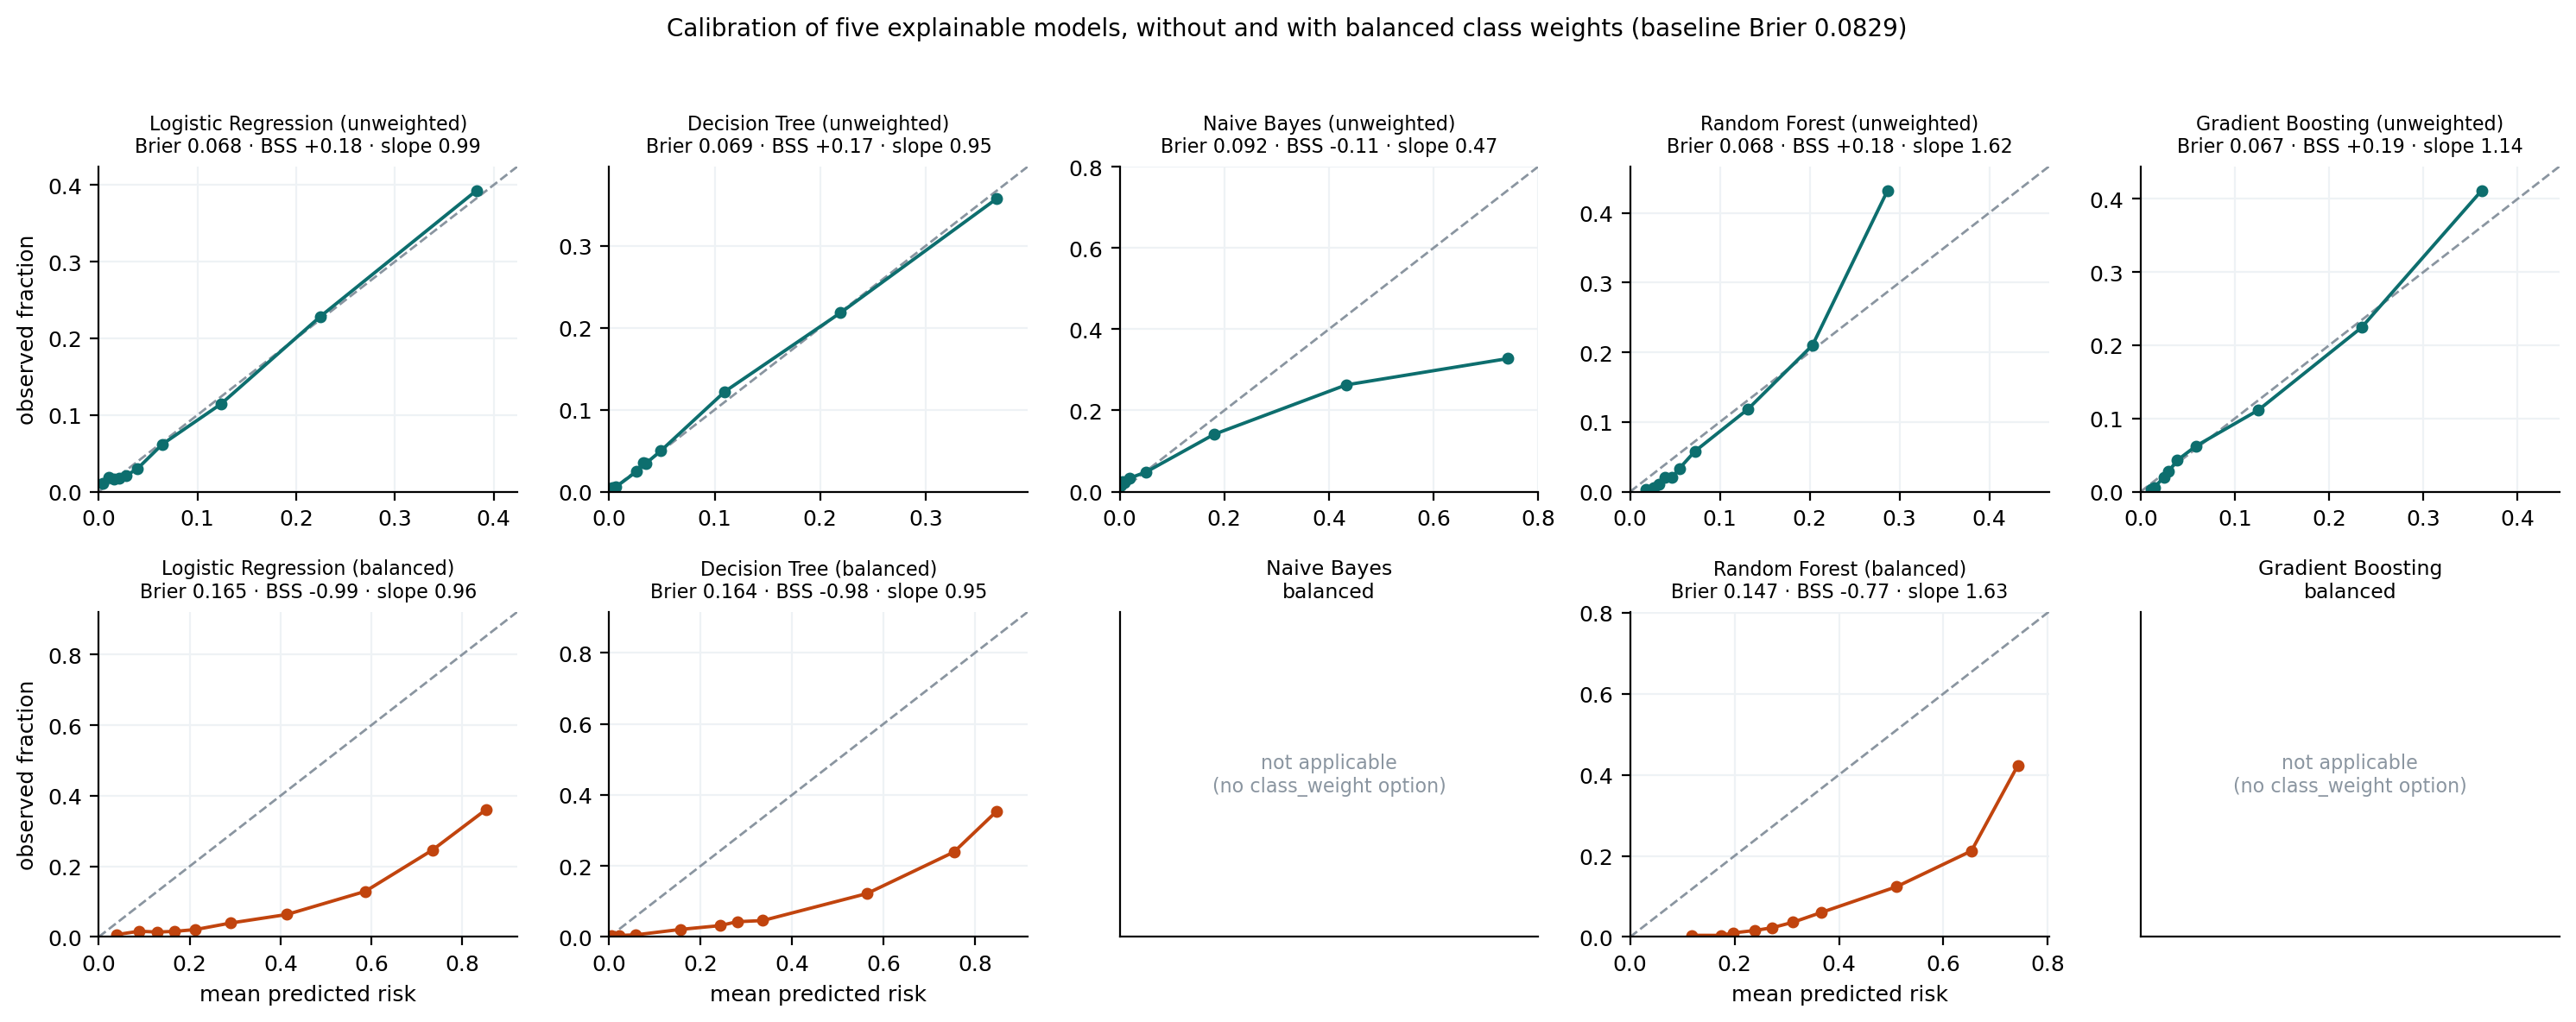
Five explainable algorithms. Calibration is reported alongside discrimination because the two diverge sharply under class weighting: weighting leaves the ranking untouched while moving predicted risk far from the observed rate.
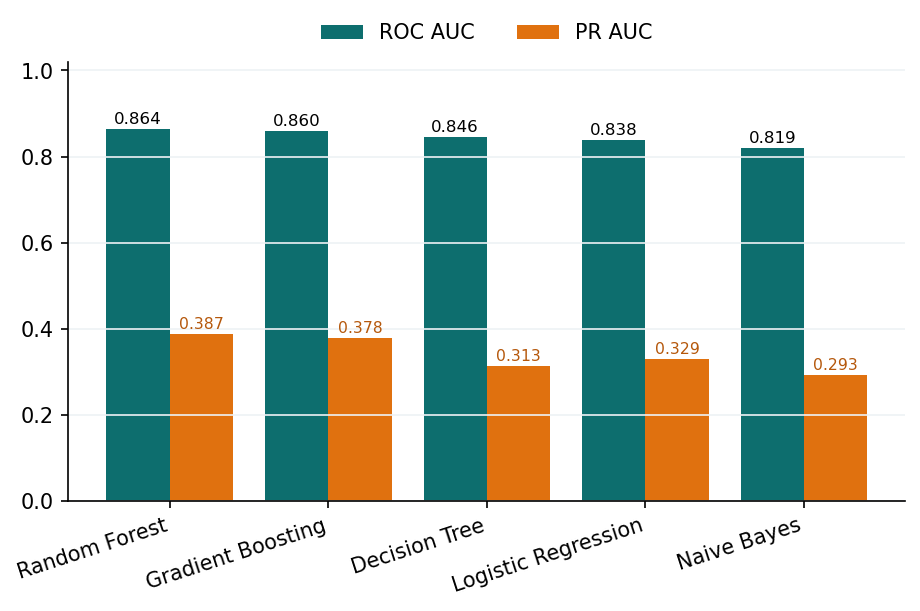
Comparison of five explainable algorithms on ROC AUC and PR AUC
Figure 3. Five algorithms on ROC AUC and PR AUC.
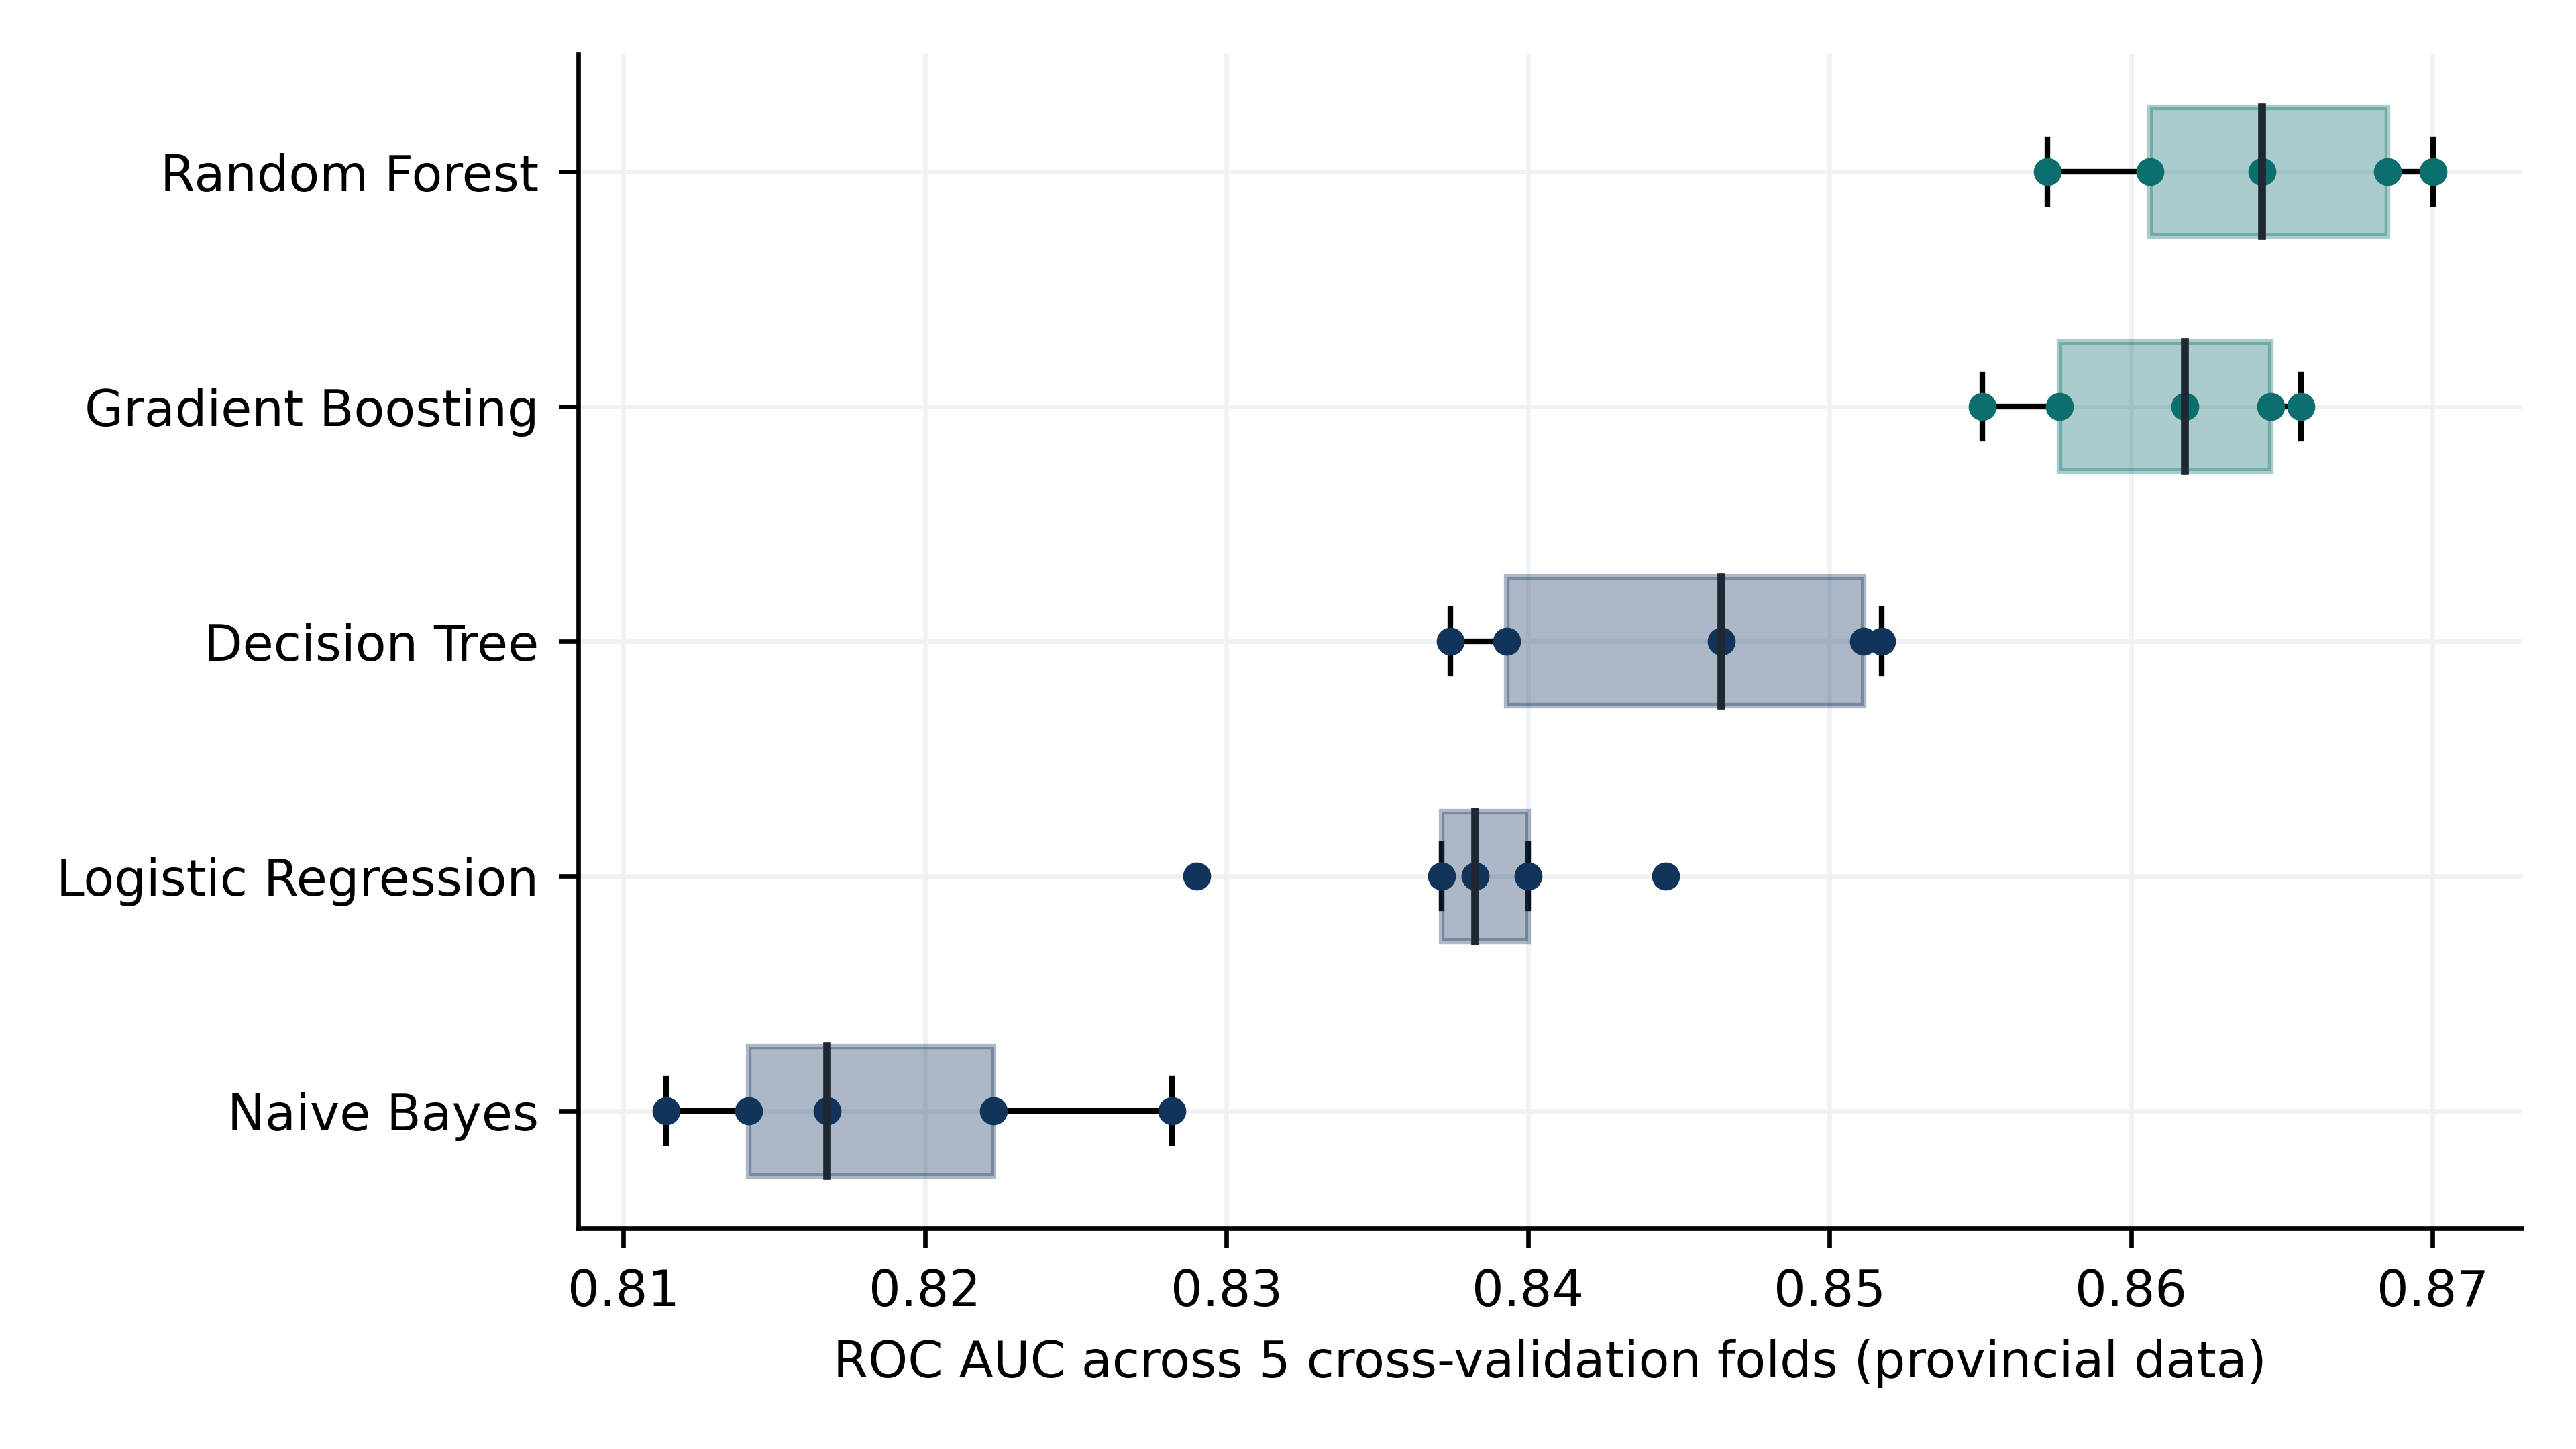
Distribution of ROC AUC across cross-validation folds
Figure 5. ROC AUC across cross-validation folds.
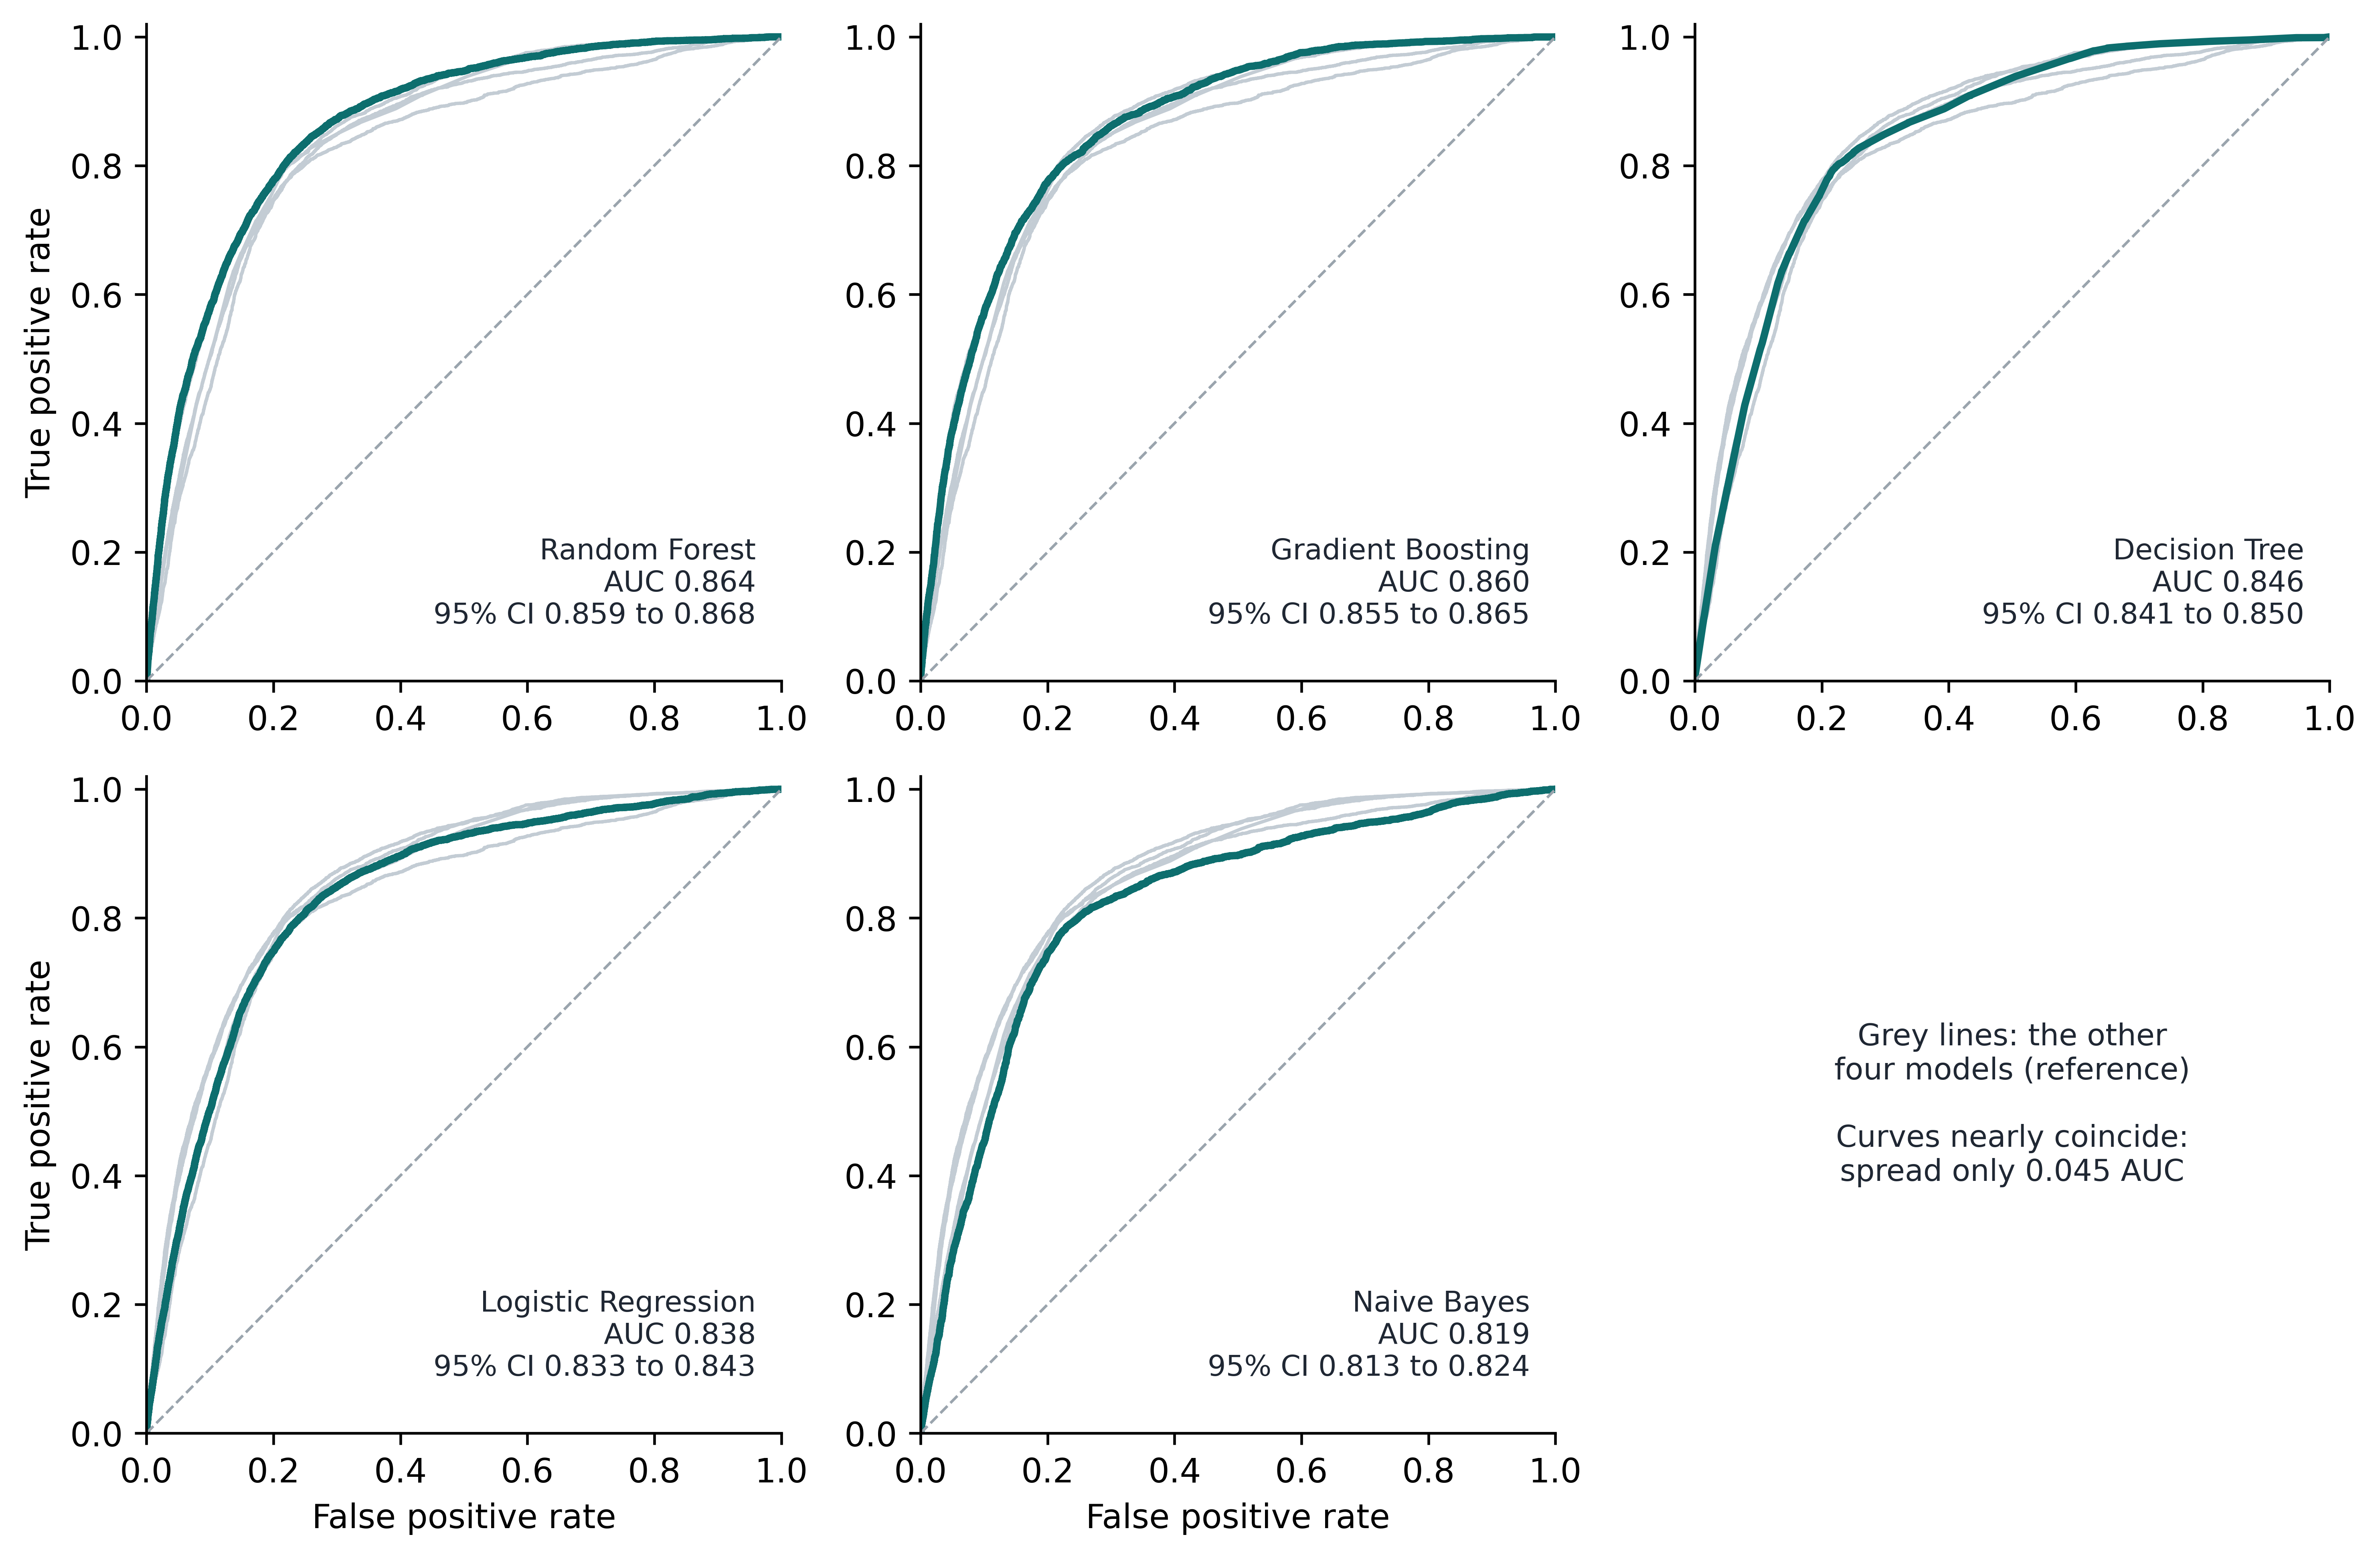
ROC curves of each algorithm
Figure 4. ROC curve of each algorithm, with the other four drawn as grey comparison lines.
Calibration curves for all five algorithms, with and without balanced class weights
Figure 8a. Calibration curves for all five algorithms, fitted with and without balanced class weights. Upper row unweighted, lower row balanced.
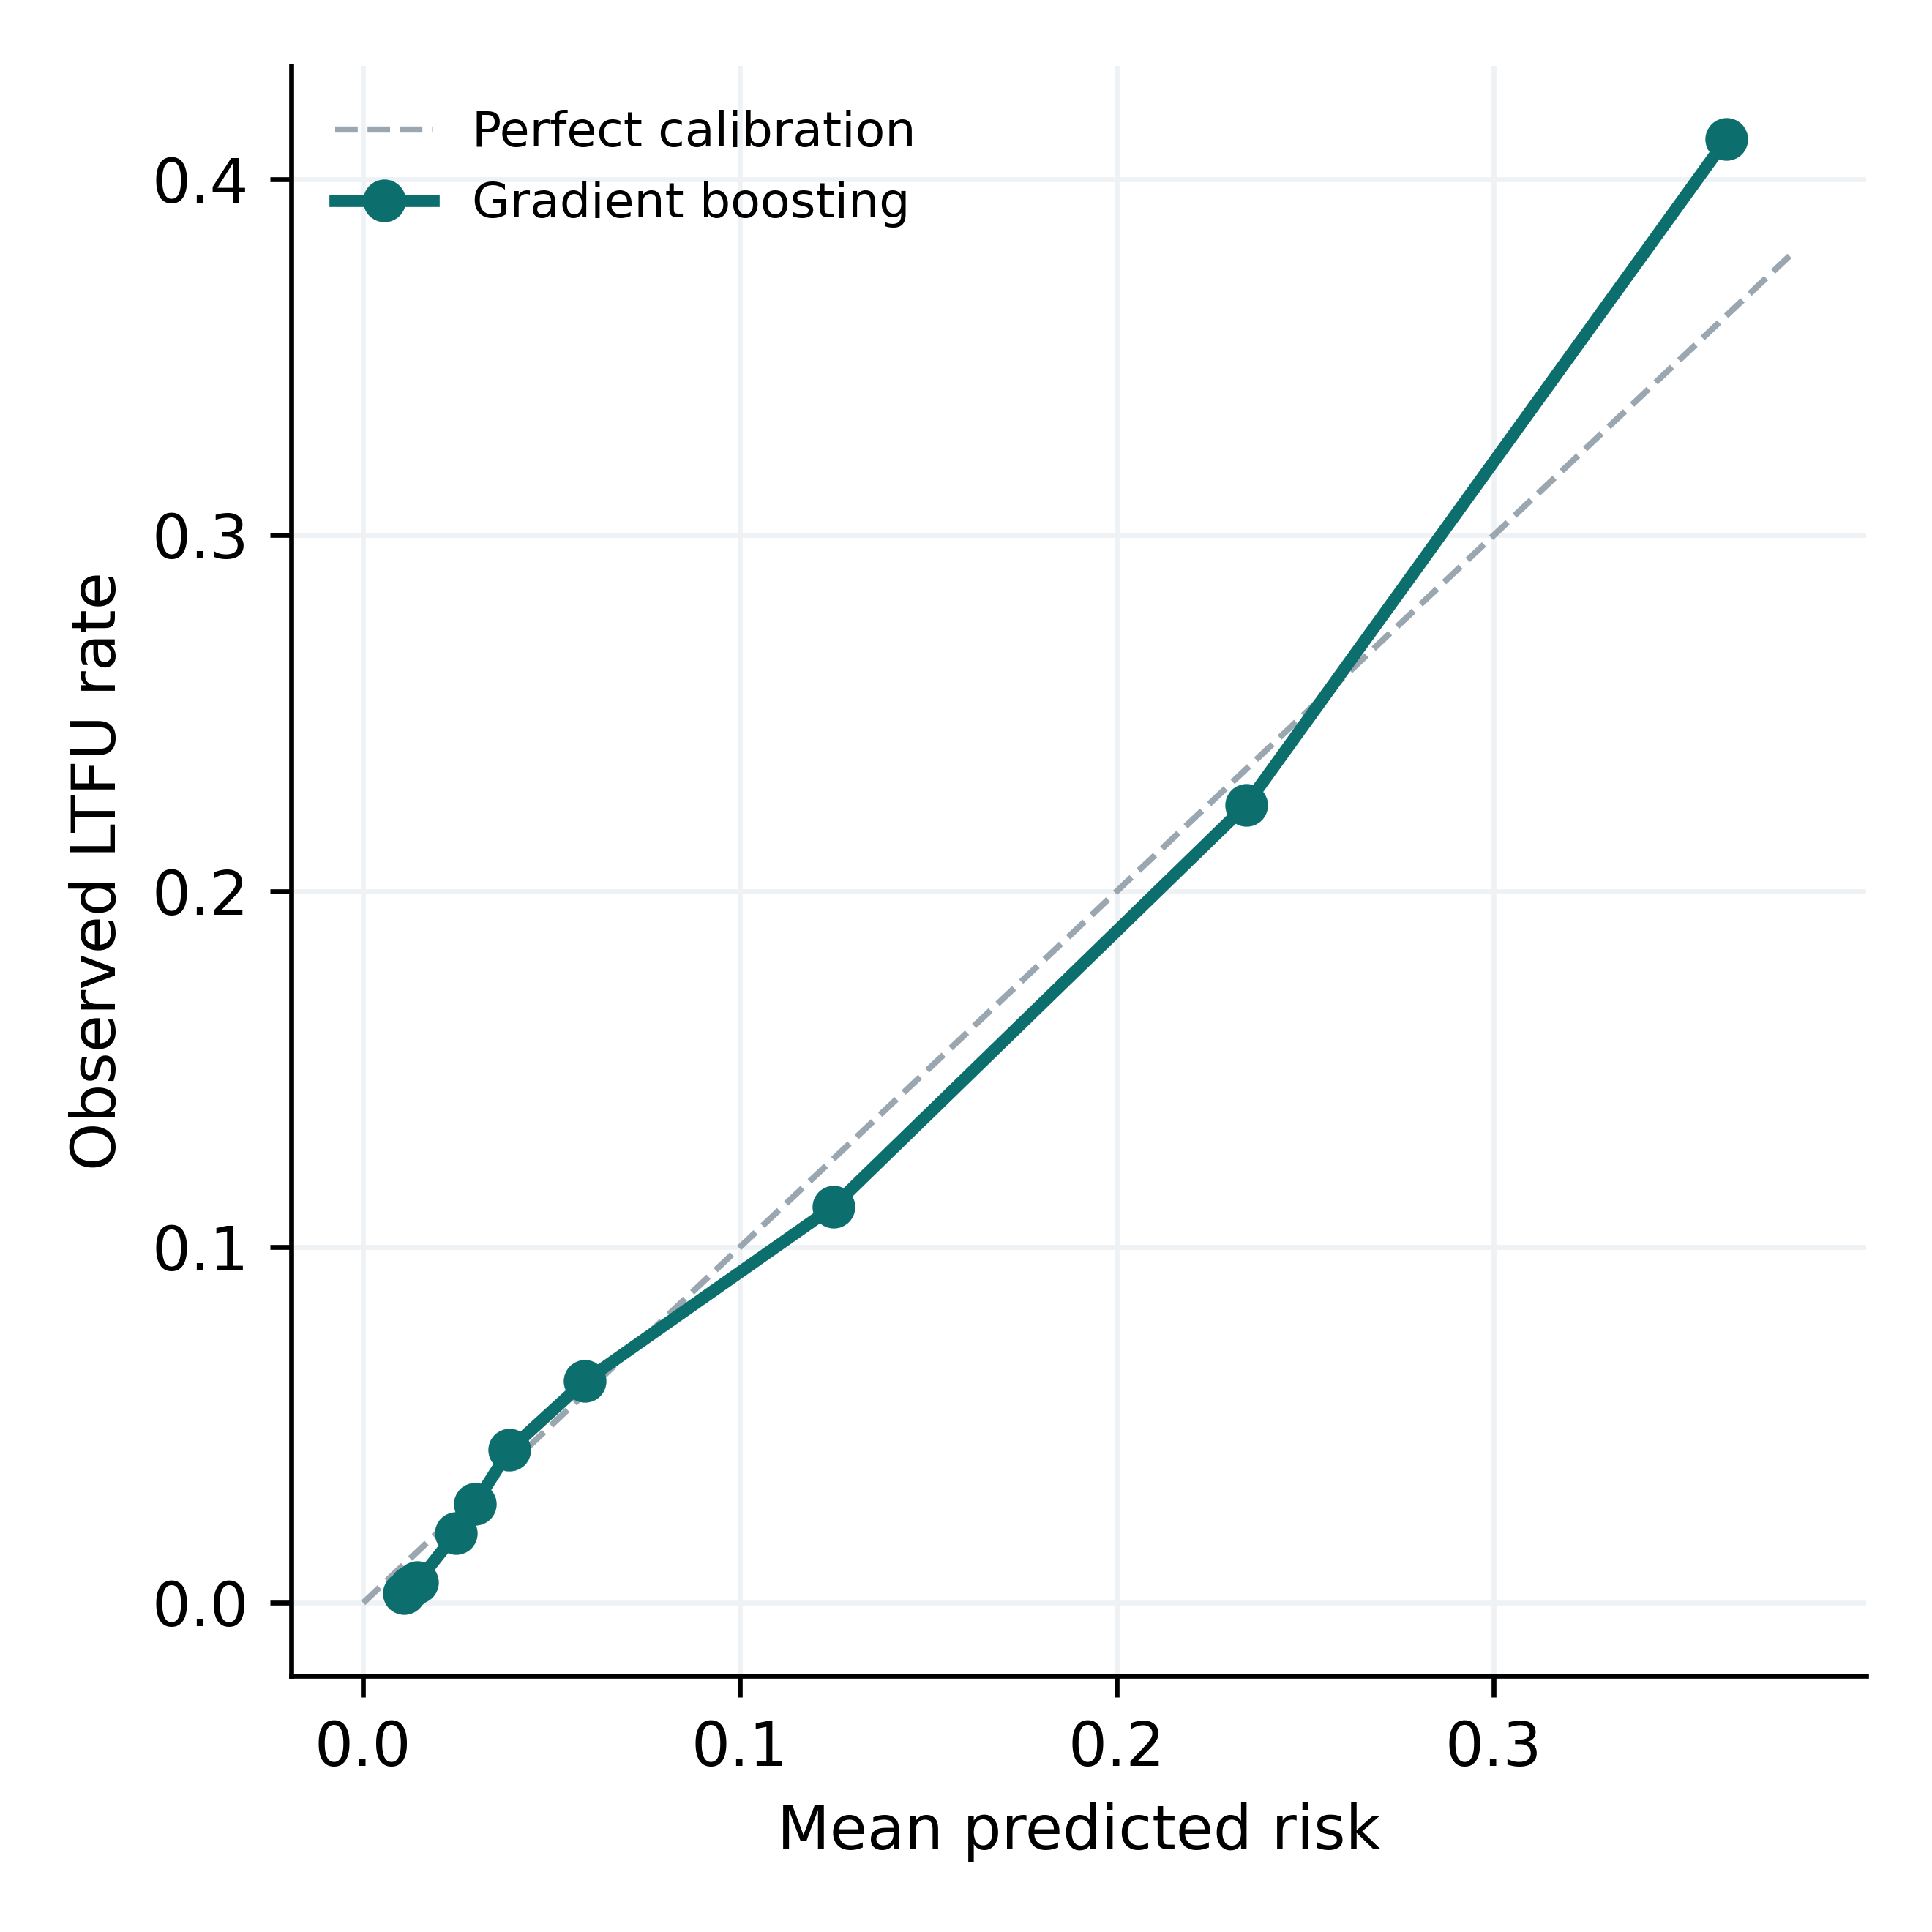
Calibration of the gradient boosting model
Figure 8. Calibration of the gradient boosting model, mean predicted risk versus observed loss rate per decile.

Effect of local recalibration

Within each held-out area a correction was estimated on one half of that area's patients and applied to the other half, and vice versa, so no recalibrated prediction was evaluated on the data that produced its own correction. This analysis has no figure in the article.

Integer risk scorecard

Points are the multivariable logistic coefficients divided by a fixed scaling constant and rounded to the nearest integer. Every level is listed, including those worth zero points, so any patient can be scored from this table alone.
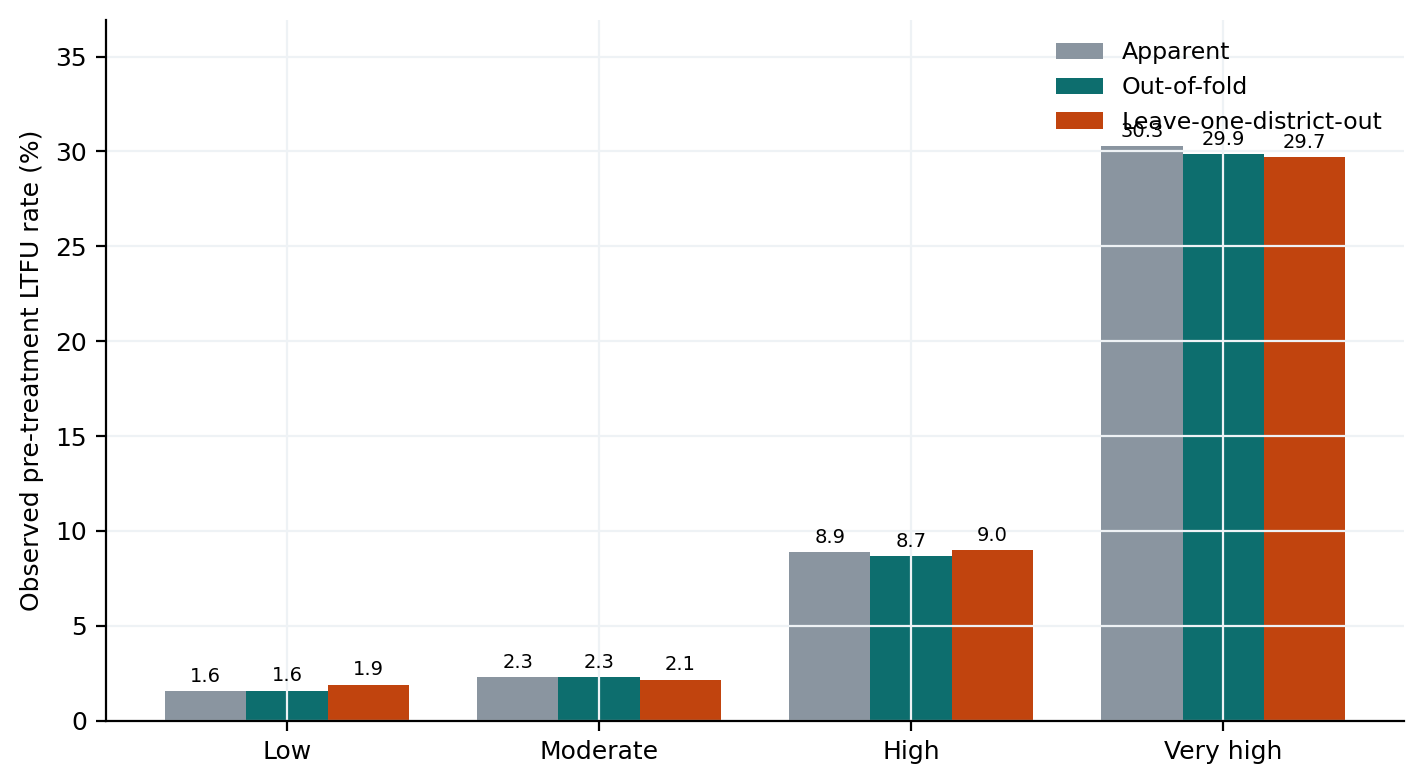
Observed loss rate by scorecard risk tier
Figure 20. Observed pre-treatment loss rate by risk tier under three validation schemes: apparent, out of fold, and leave-one-district-out.

Clinical operating characteristics

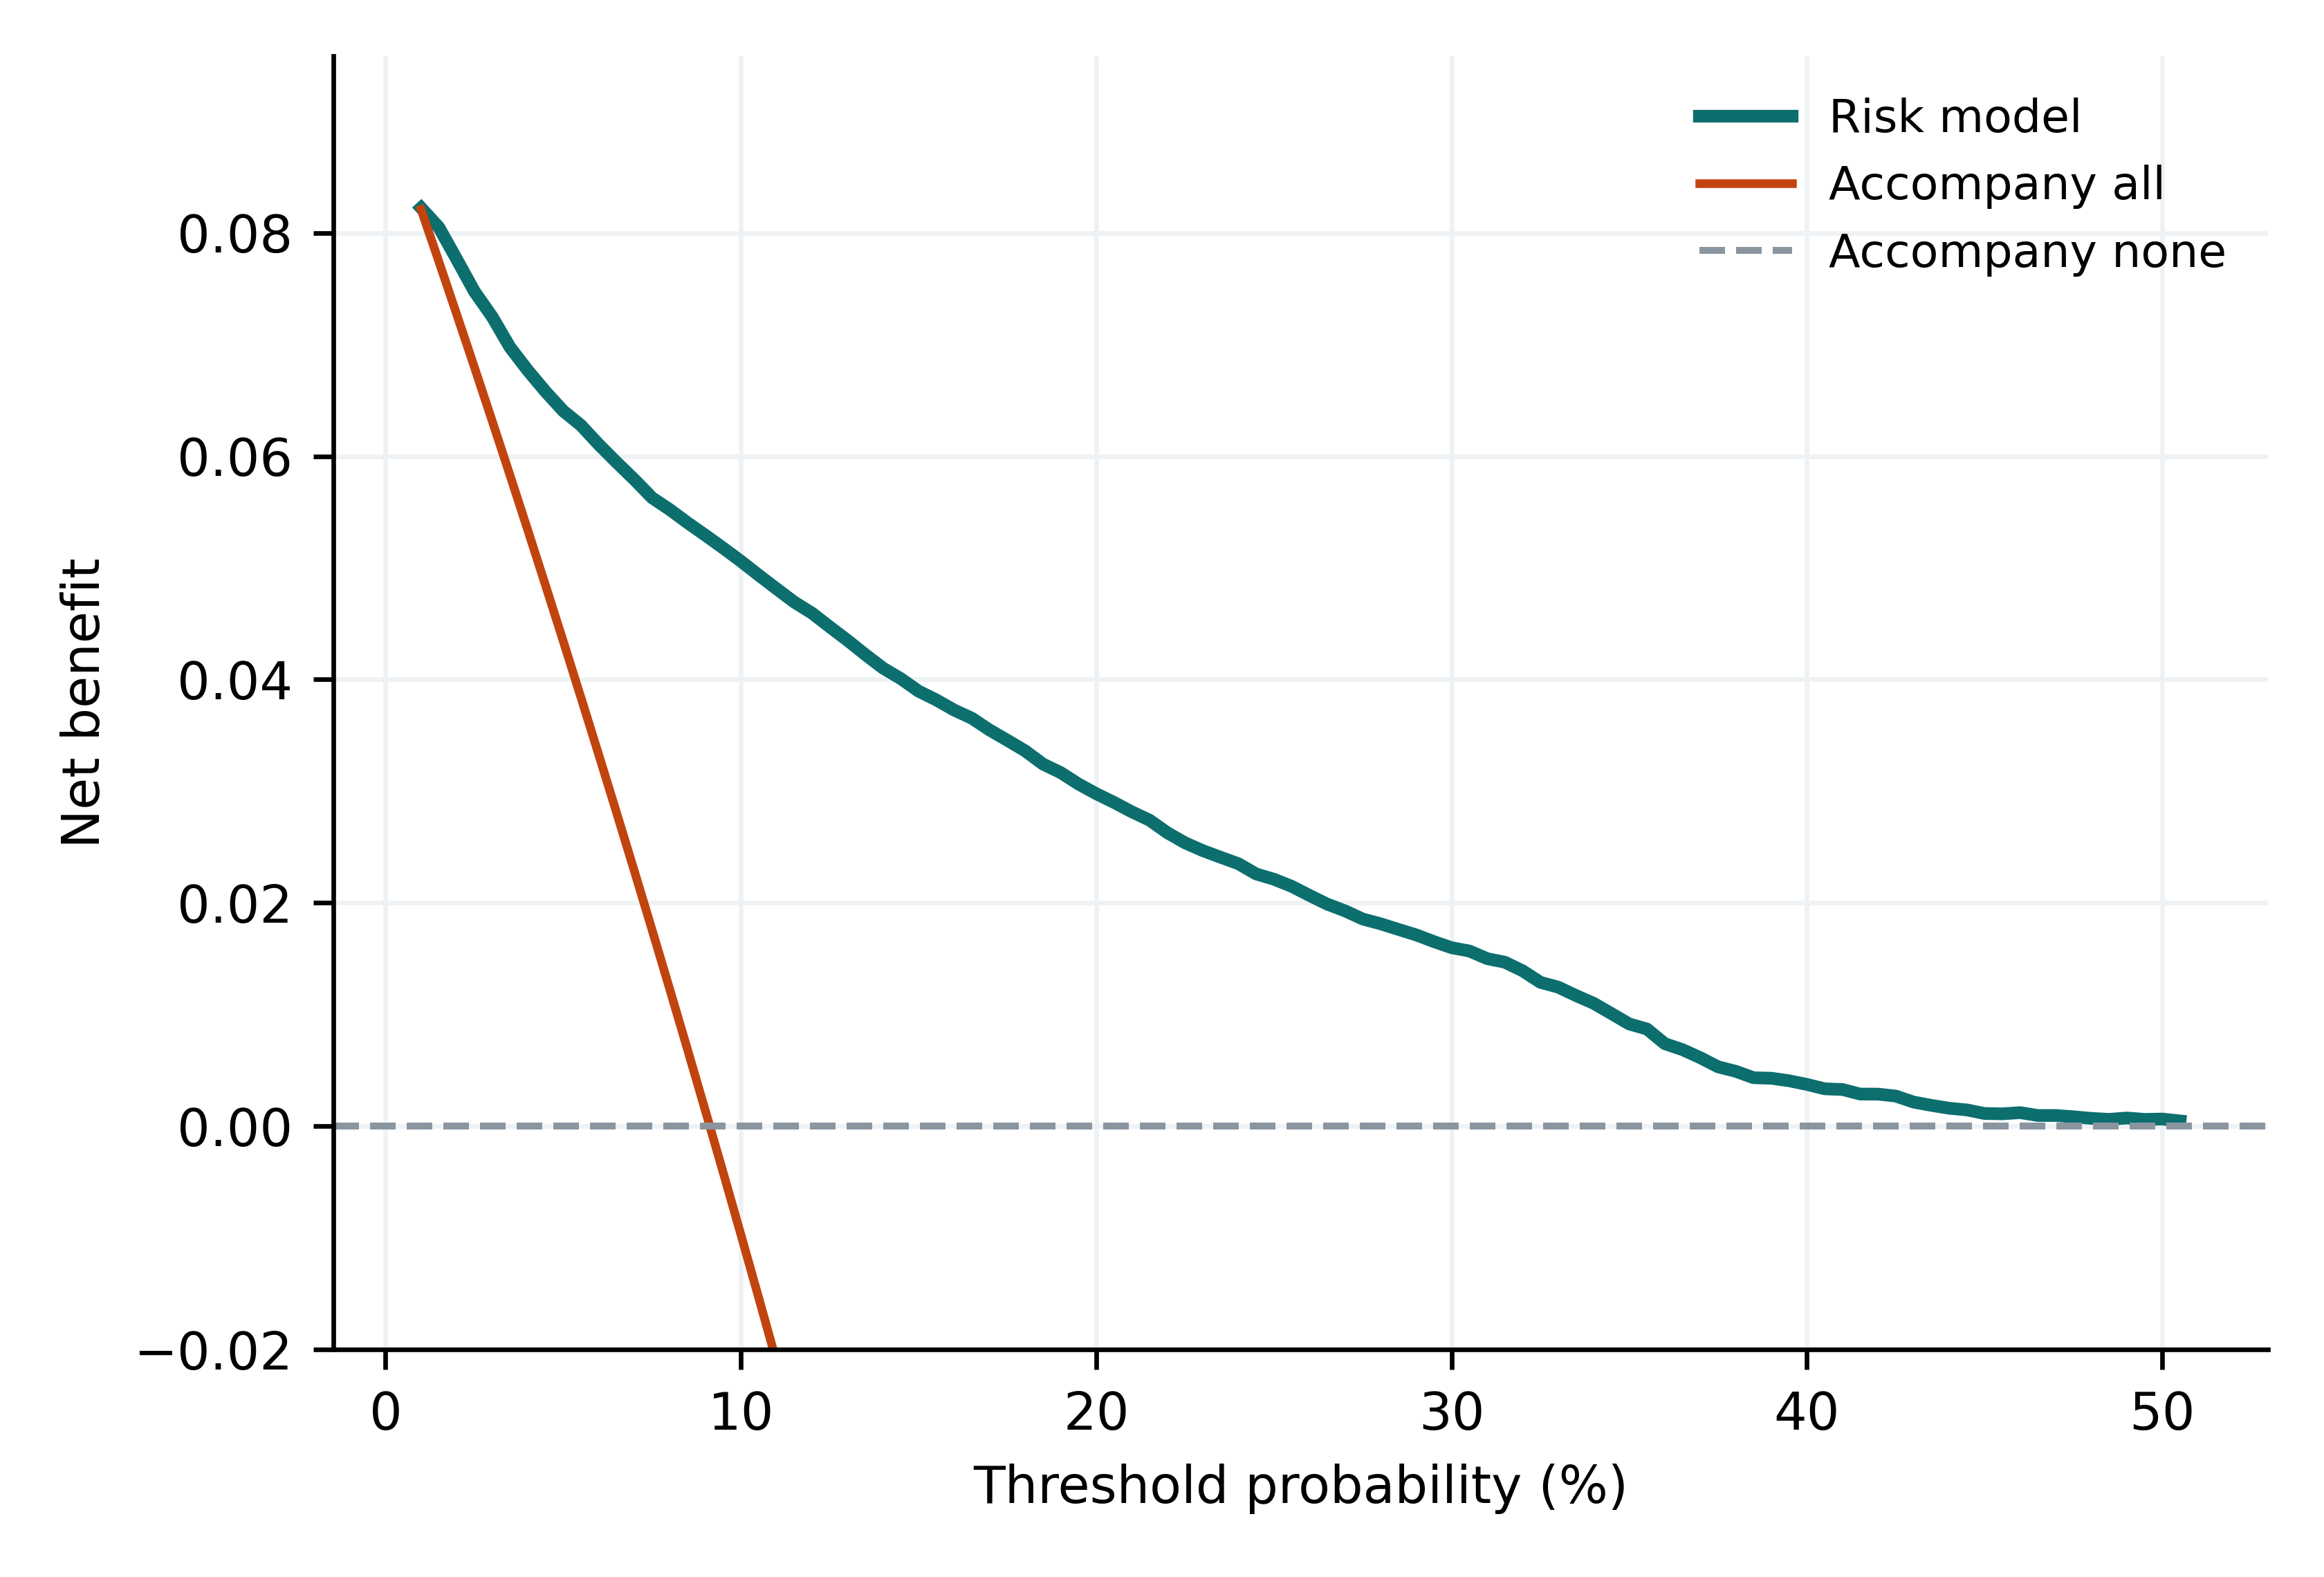
Decision curve analysis, net benefit
Figure 19. Decision curve analysis: net benefit of the risk model versus accompanying all patients or accompanying none.

Spatial statistics

Global Moran index computed on the per-area calibration gap under three neighbourhood definitions, with significance from 9,999 permutations. This analysis has no figure in the article.

Feature selection

Three strategies compared under the same leave-one-district-out pipeline. The medians coincide, so feature selection is a choice of interpretive purpose rather than a lever for performance.
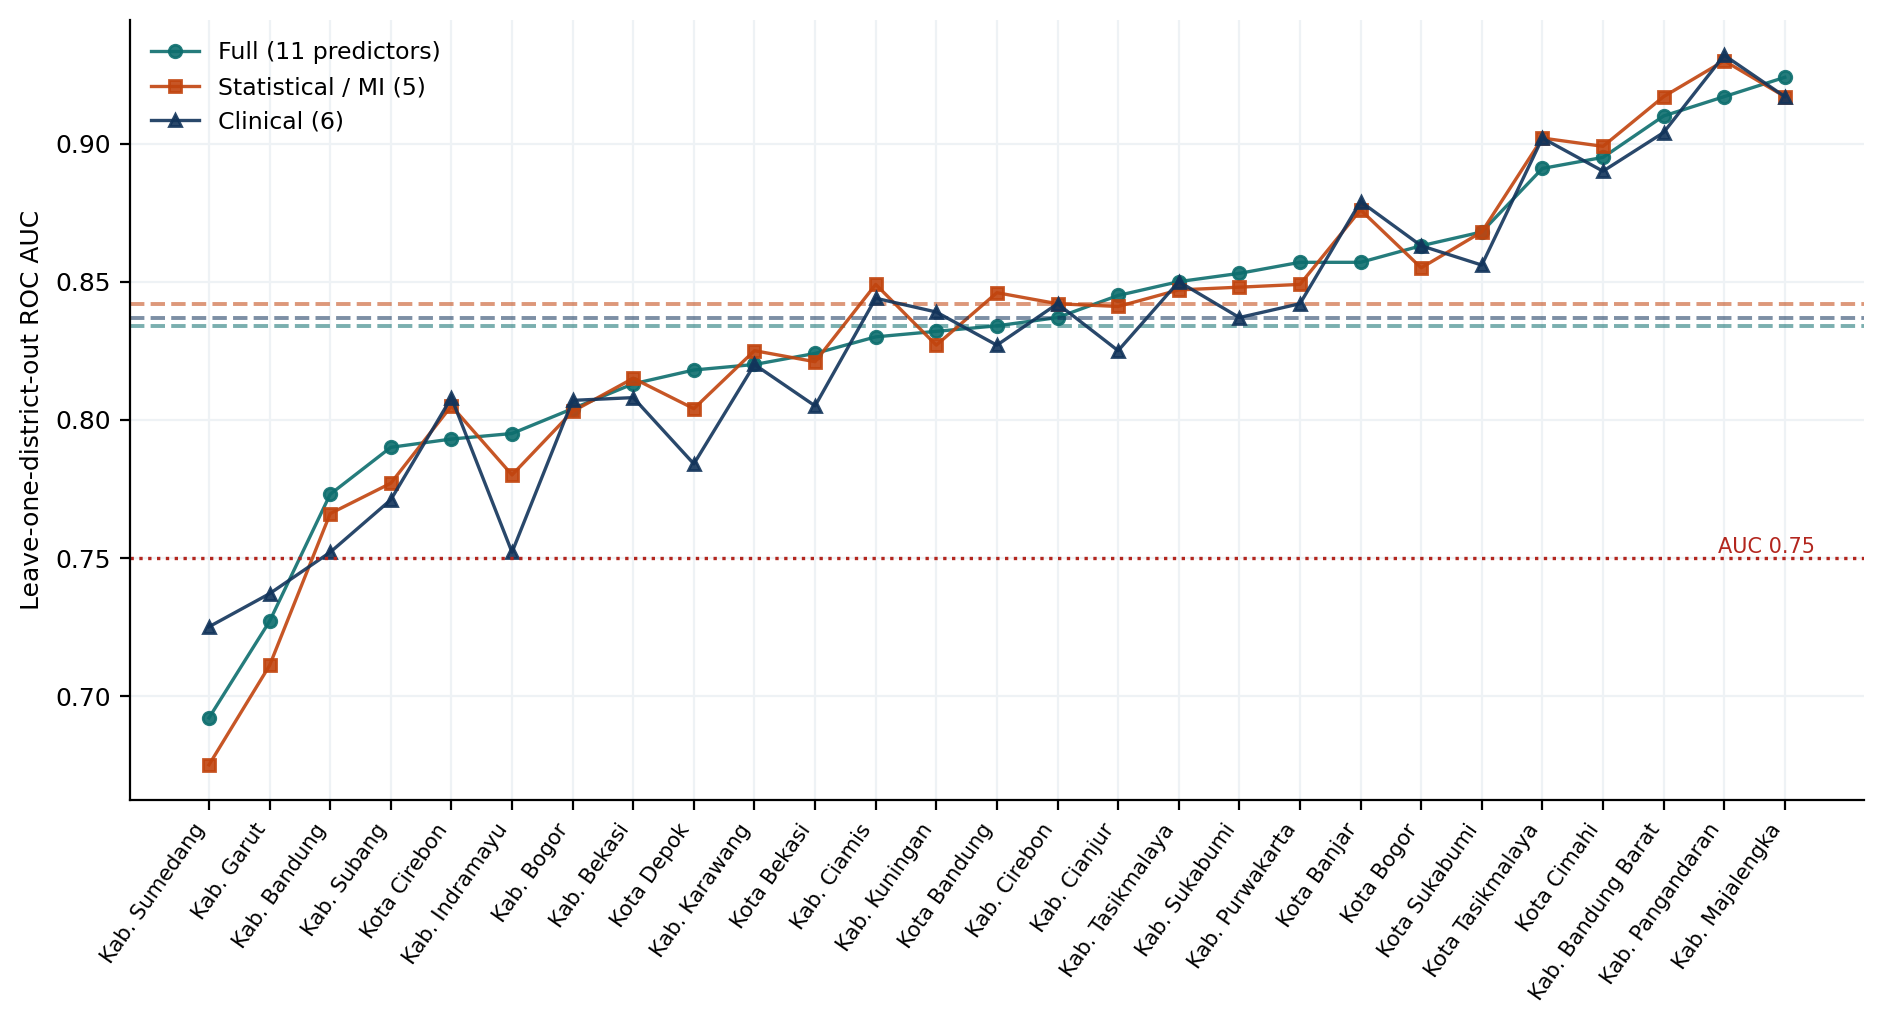
Leave-one-district-out AUC for the three feature selection scenarios
Figure 12. Leave-one-district-out AUC per area for the three feature selection scenarios; dashed lines mark each median.
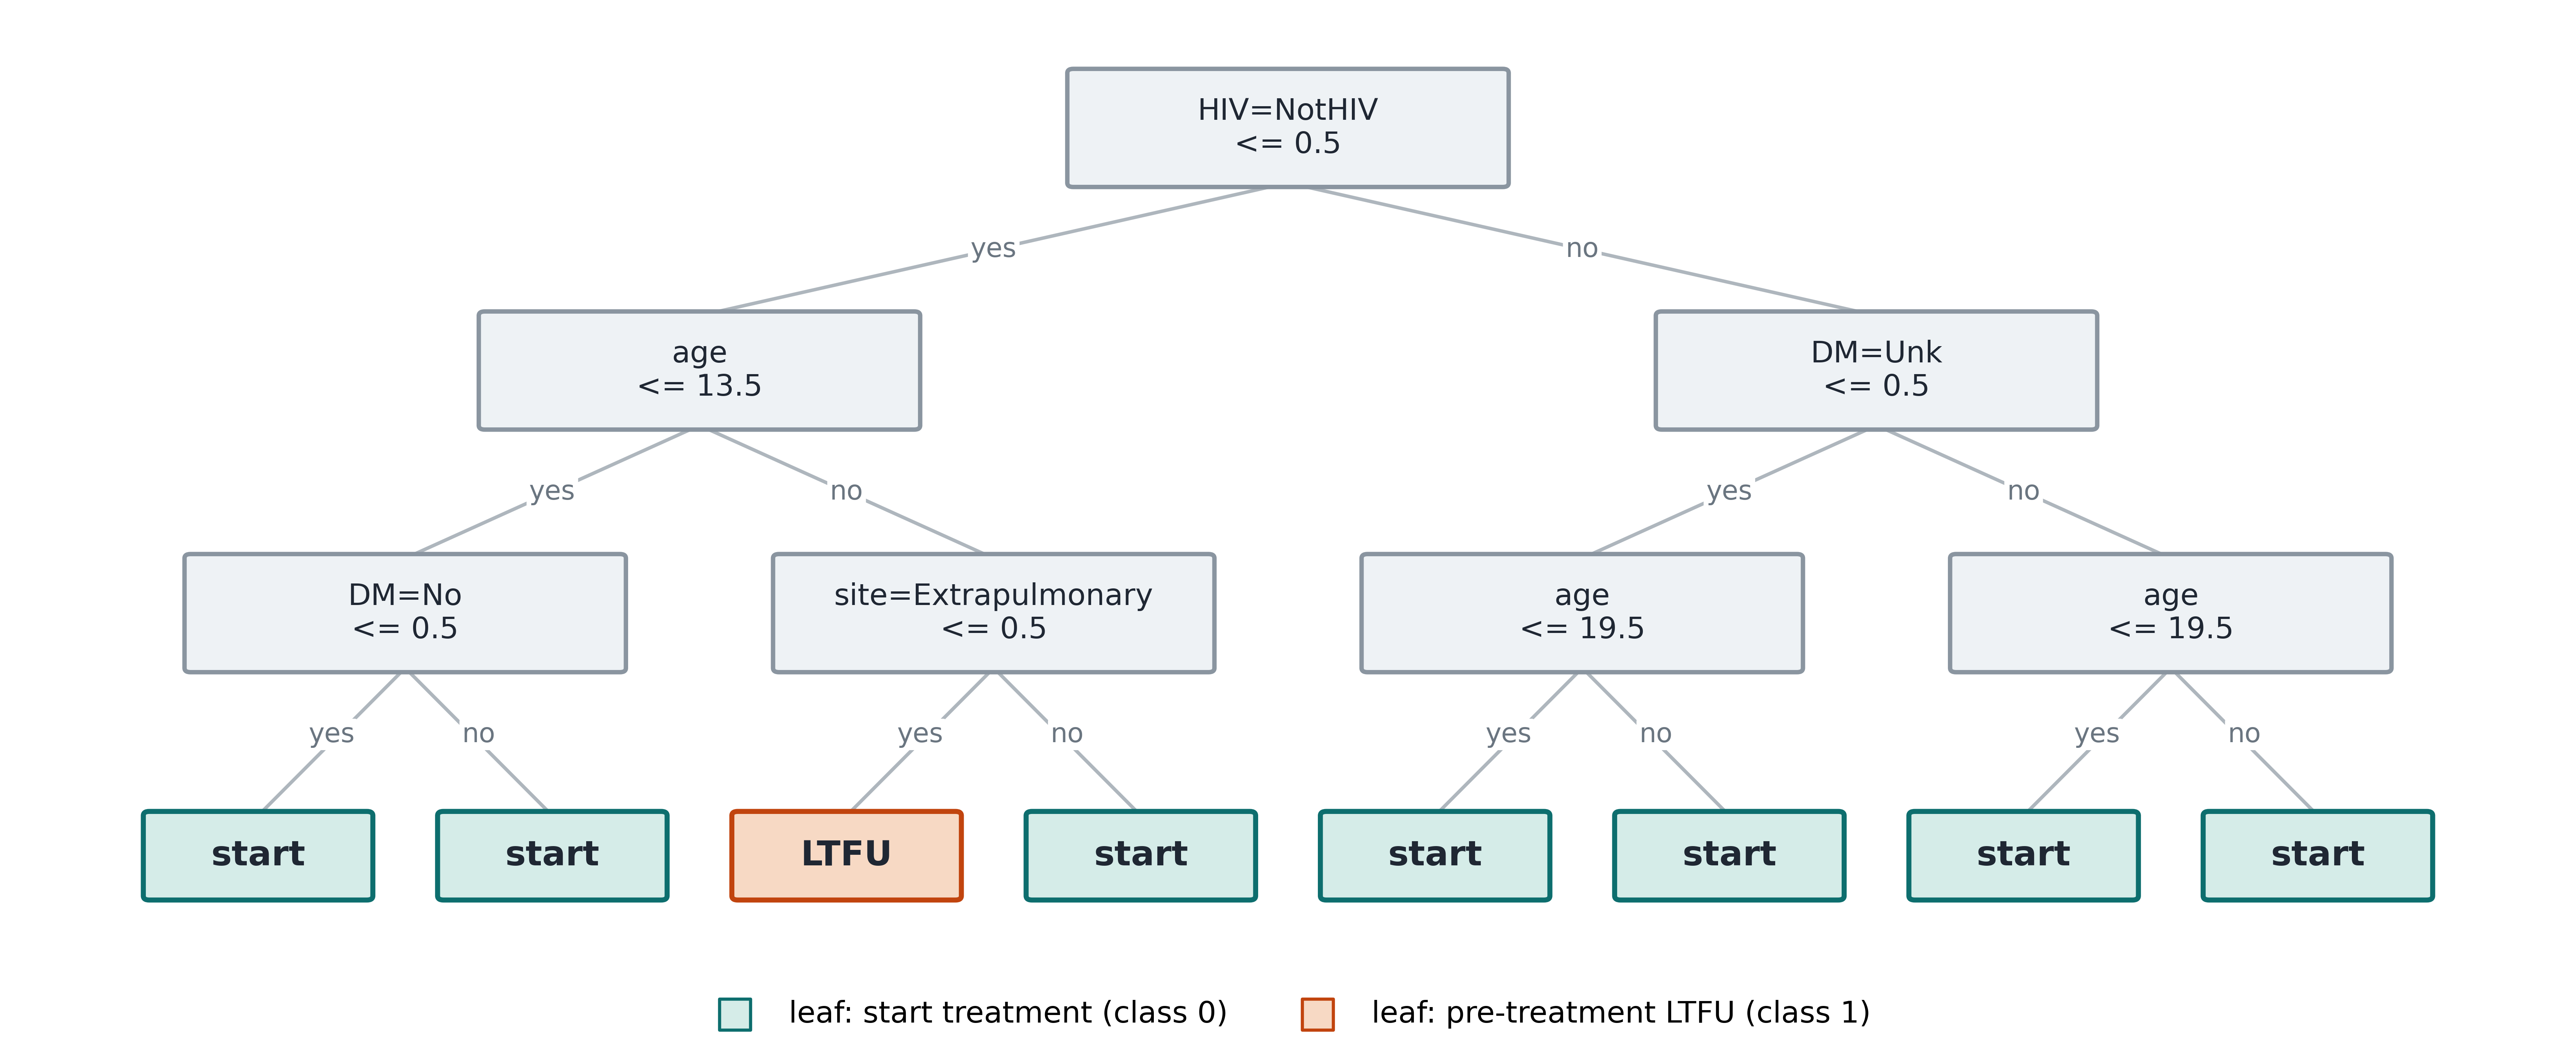
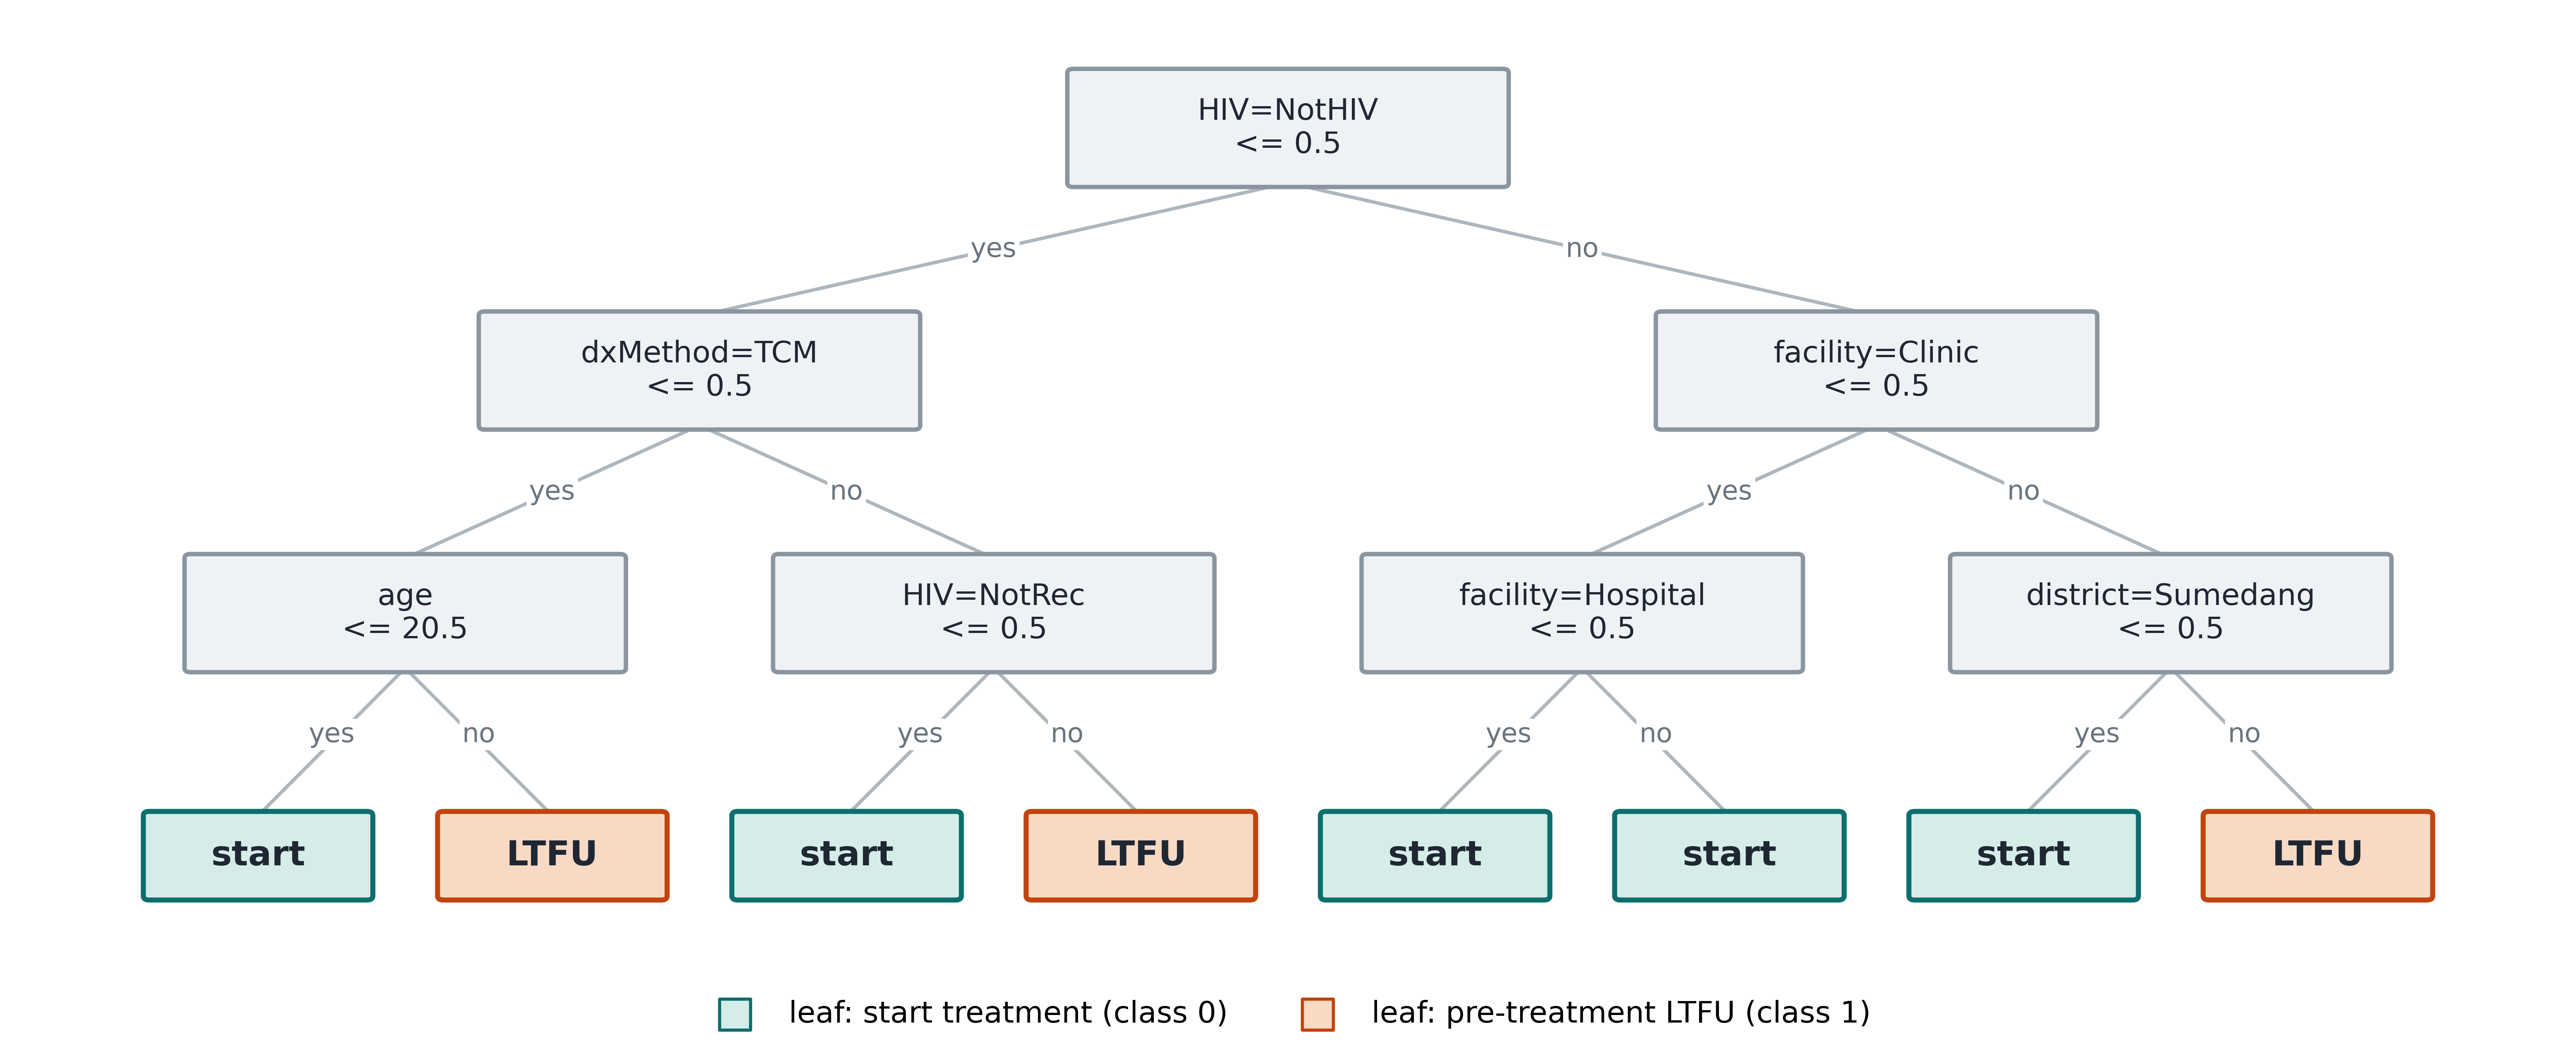
Decision tree with statistical feature selection
Figure 10. Decision tree, statistical selection.
Decision tree with clinical feature selection
Figure 11. Decision tree, clinical selection.

Neither burden nor data quantity explains model fit

Model misfit across areas is driven by recording completeness and a residual local effect, not by how much tuberculosis an area carries or how many records it contributes.
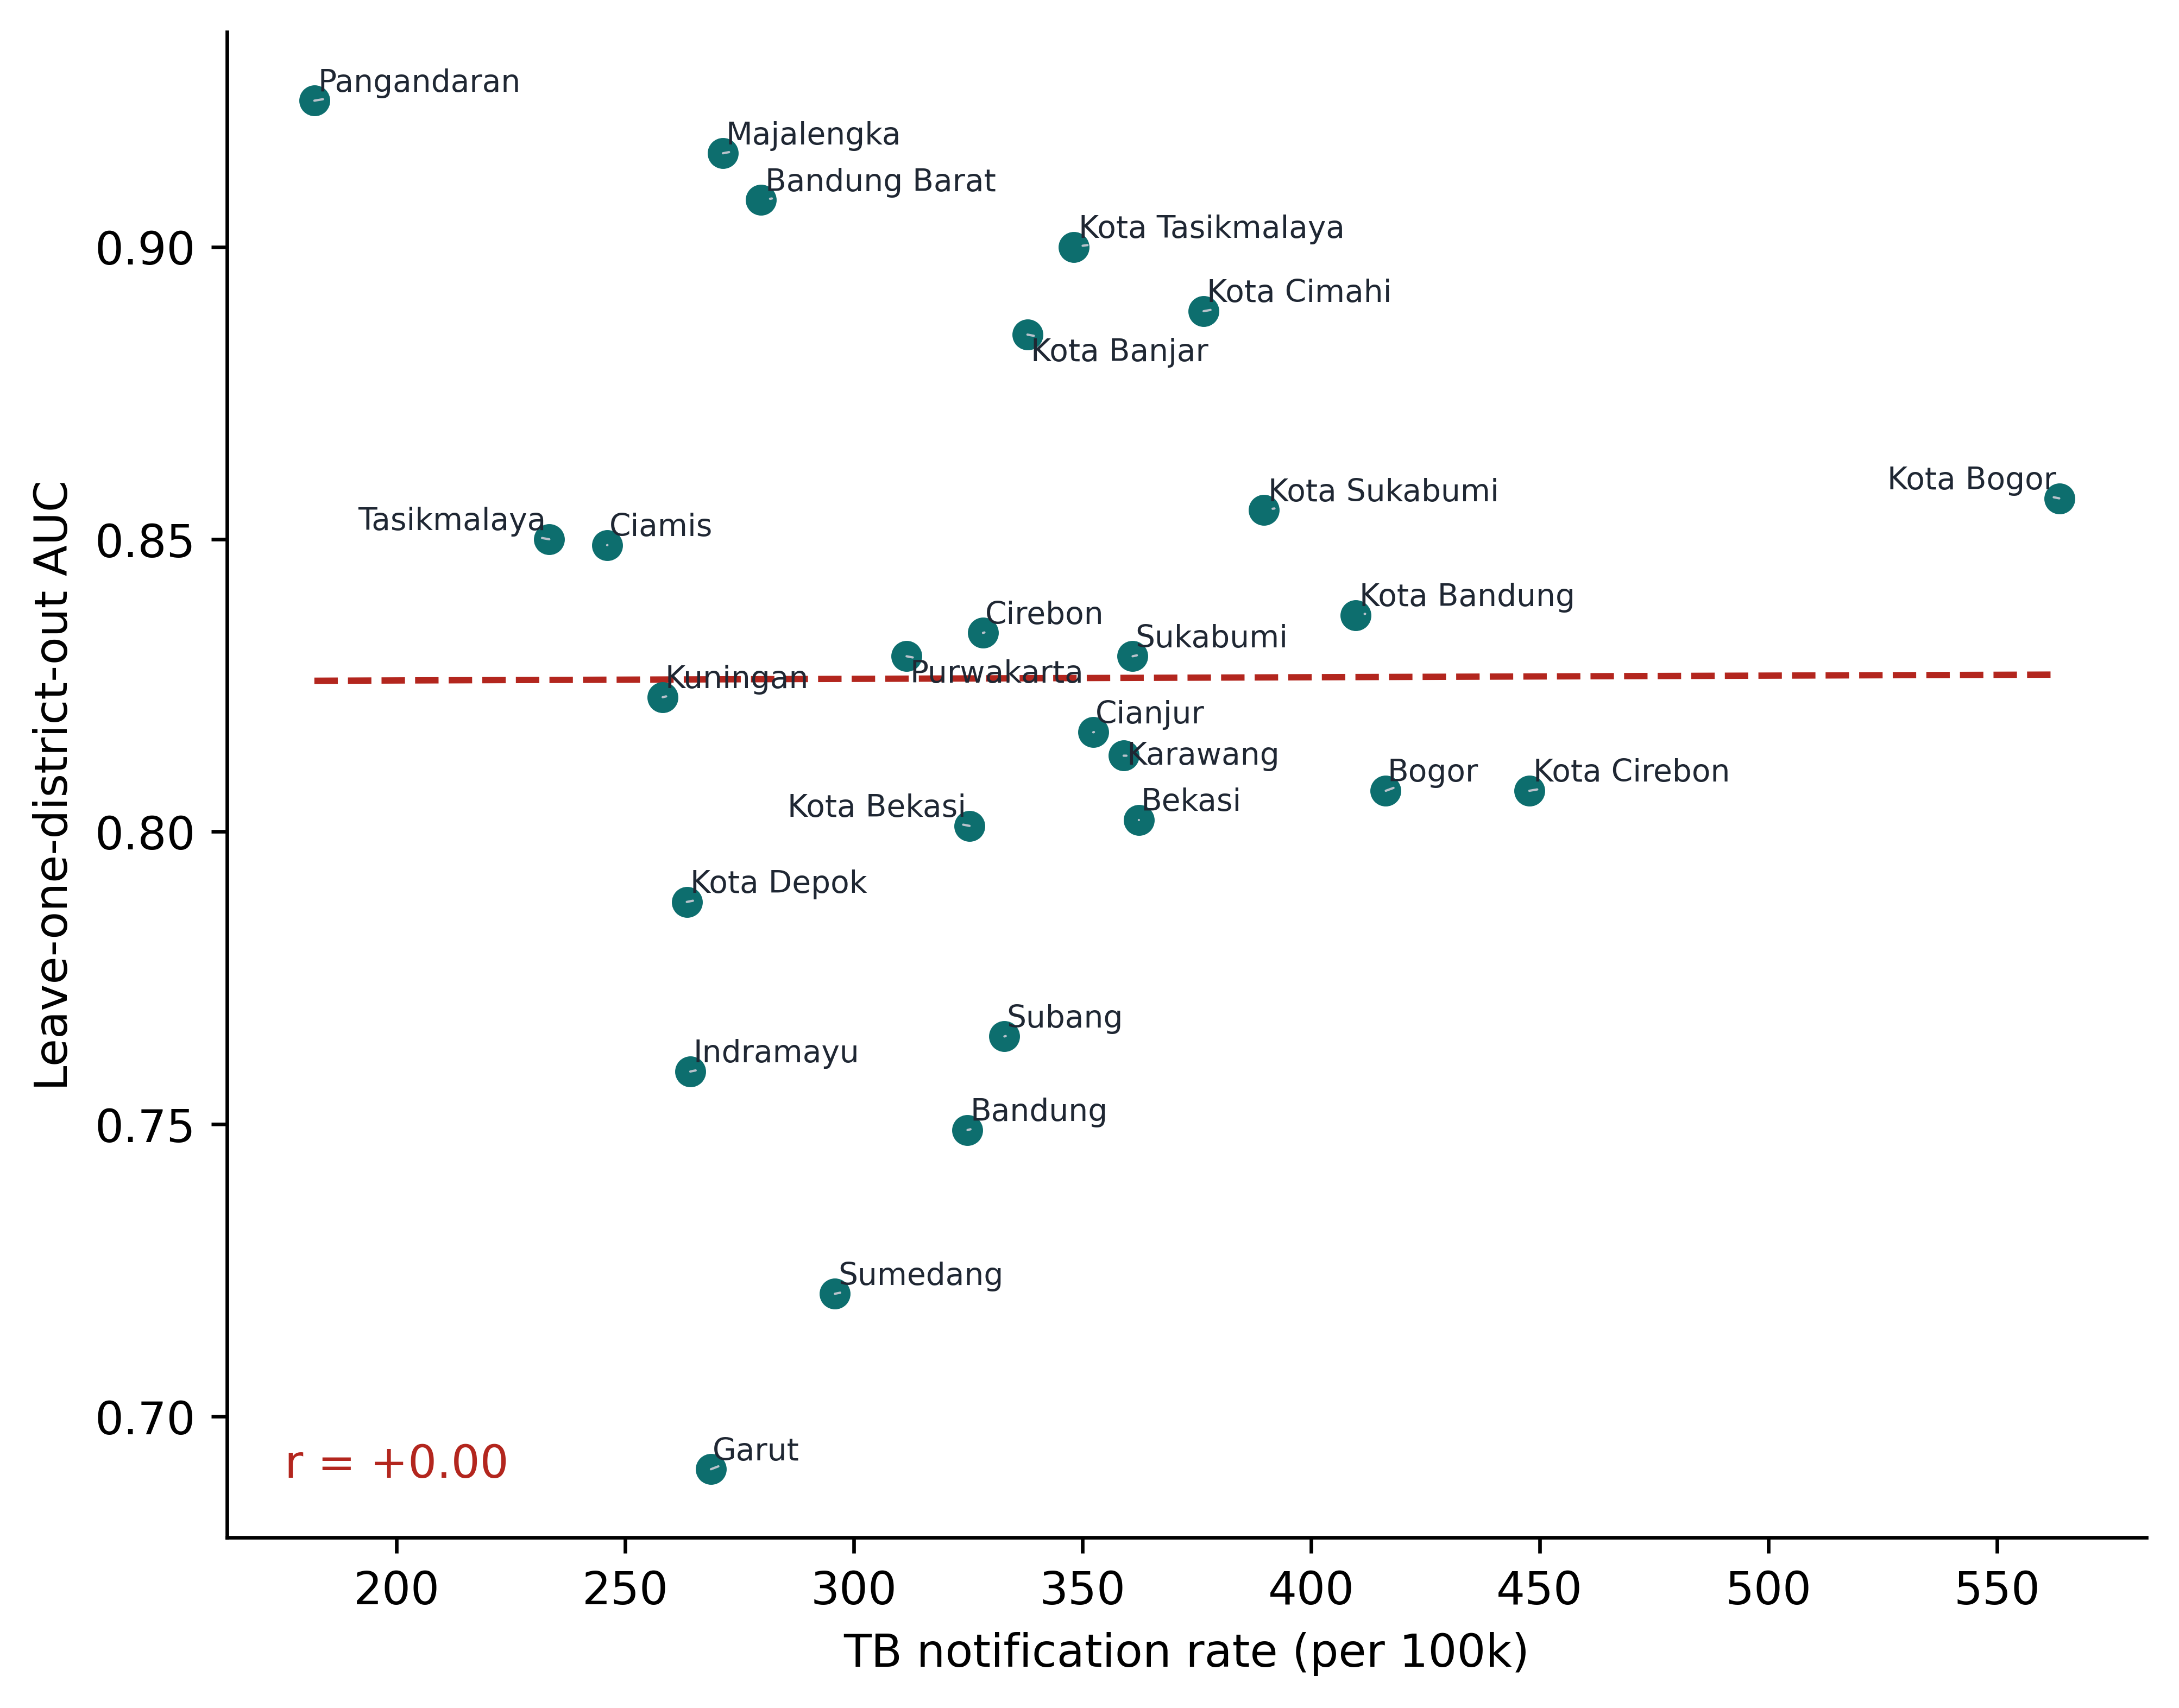
Notification rate against leave-one-district-out AUC
Figure 17. Tuberculosis notification rate against leave-one-district-out AUC.
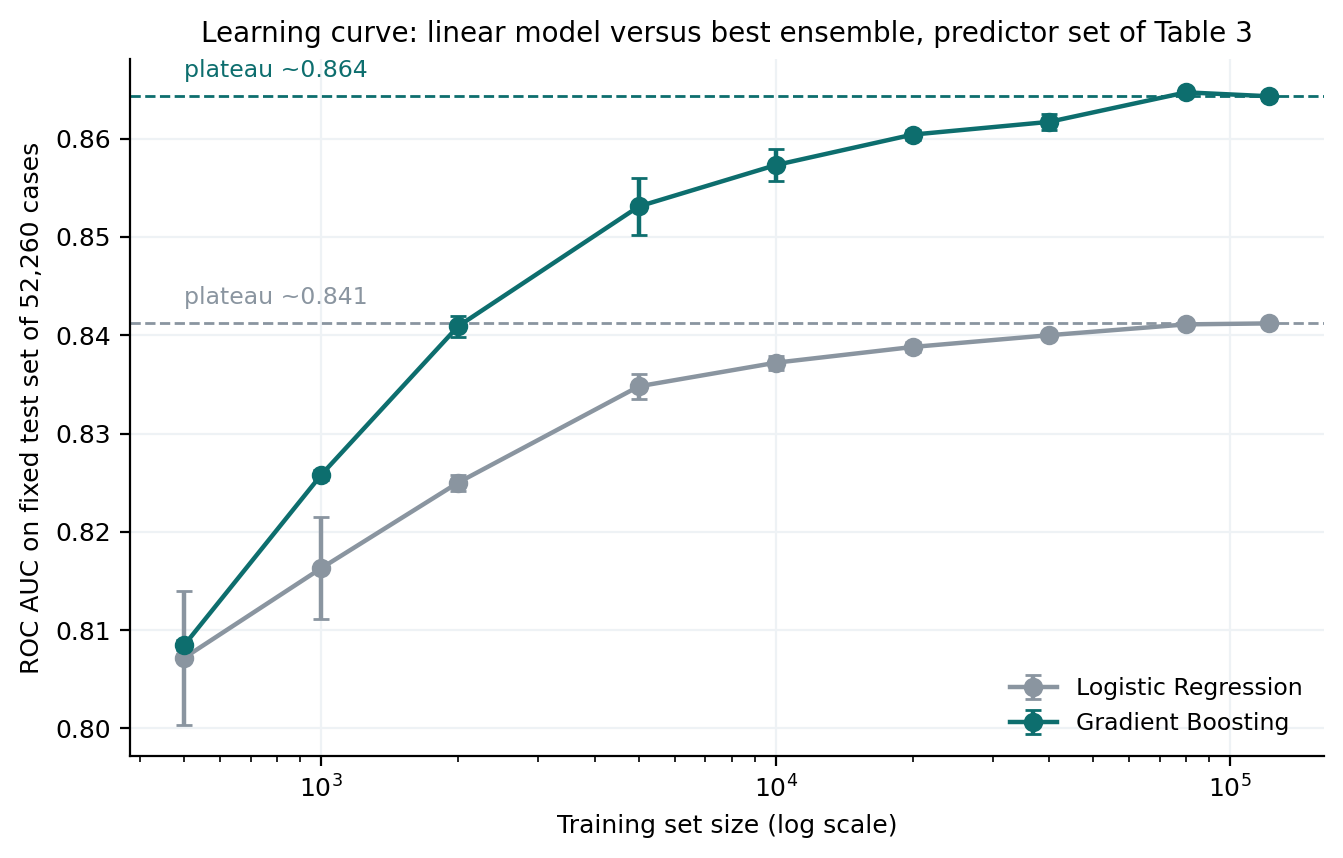
Learning curve for logistic regression and gradient boosting
Figure 18. Learning curve for the linear model and the best ensemble.

Study context

Where the loss sits geographically, and how the analysis was built.
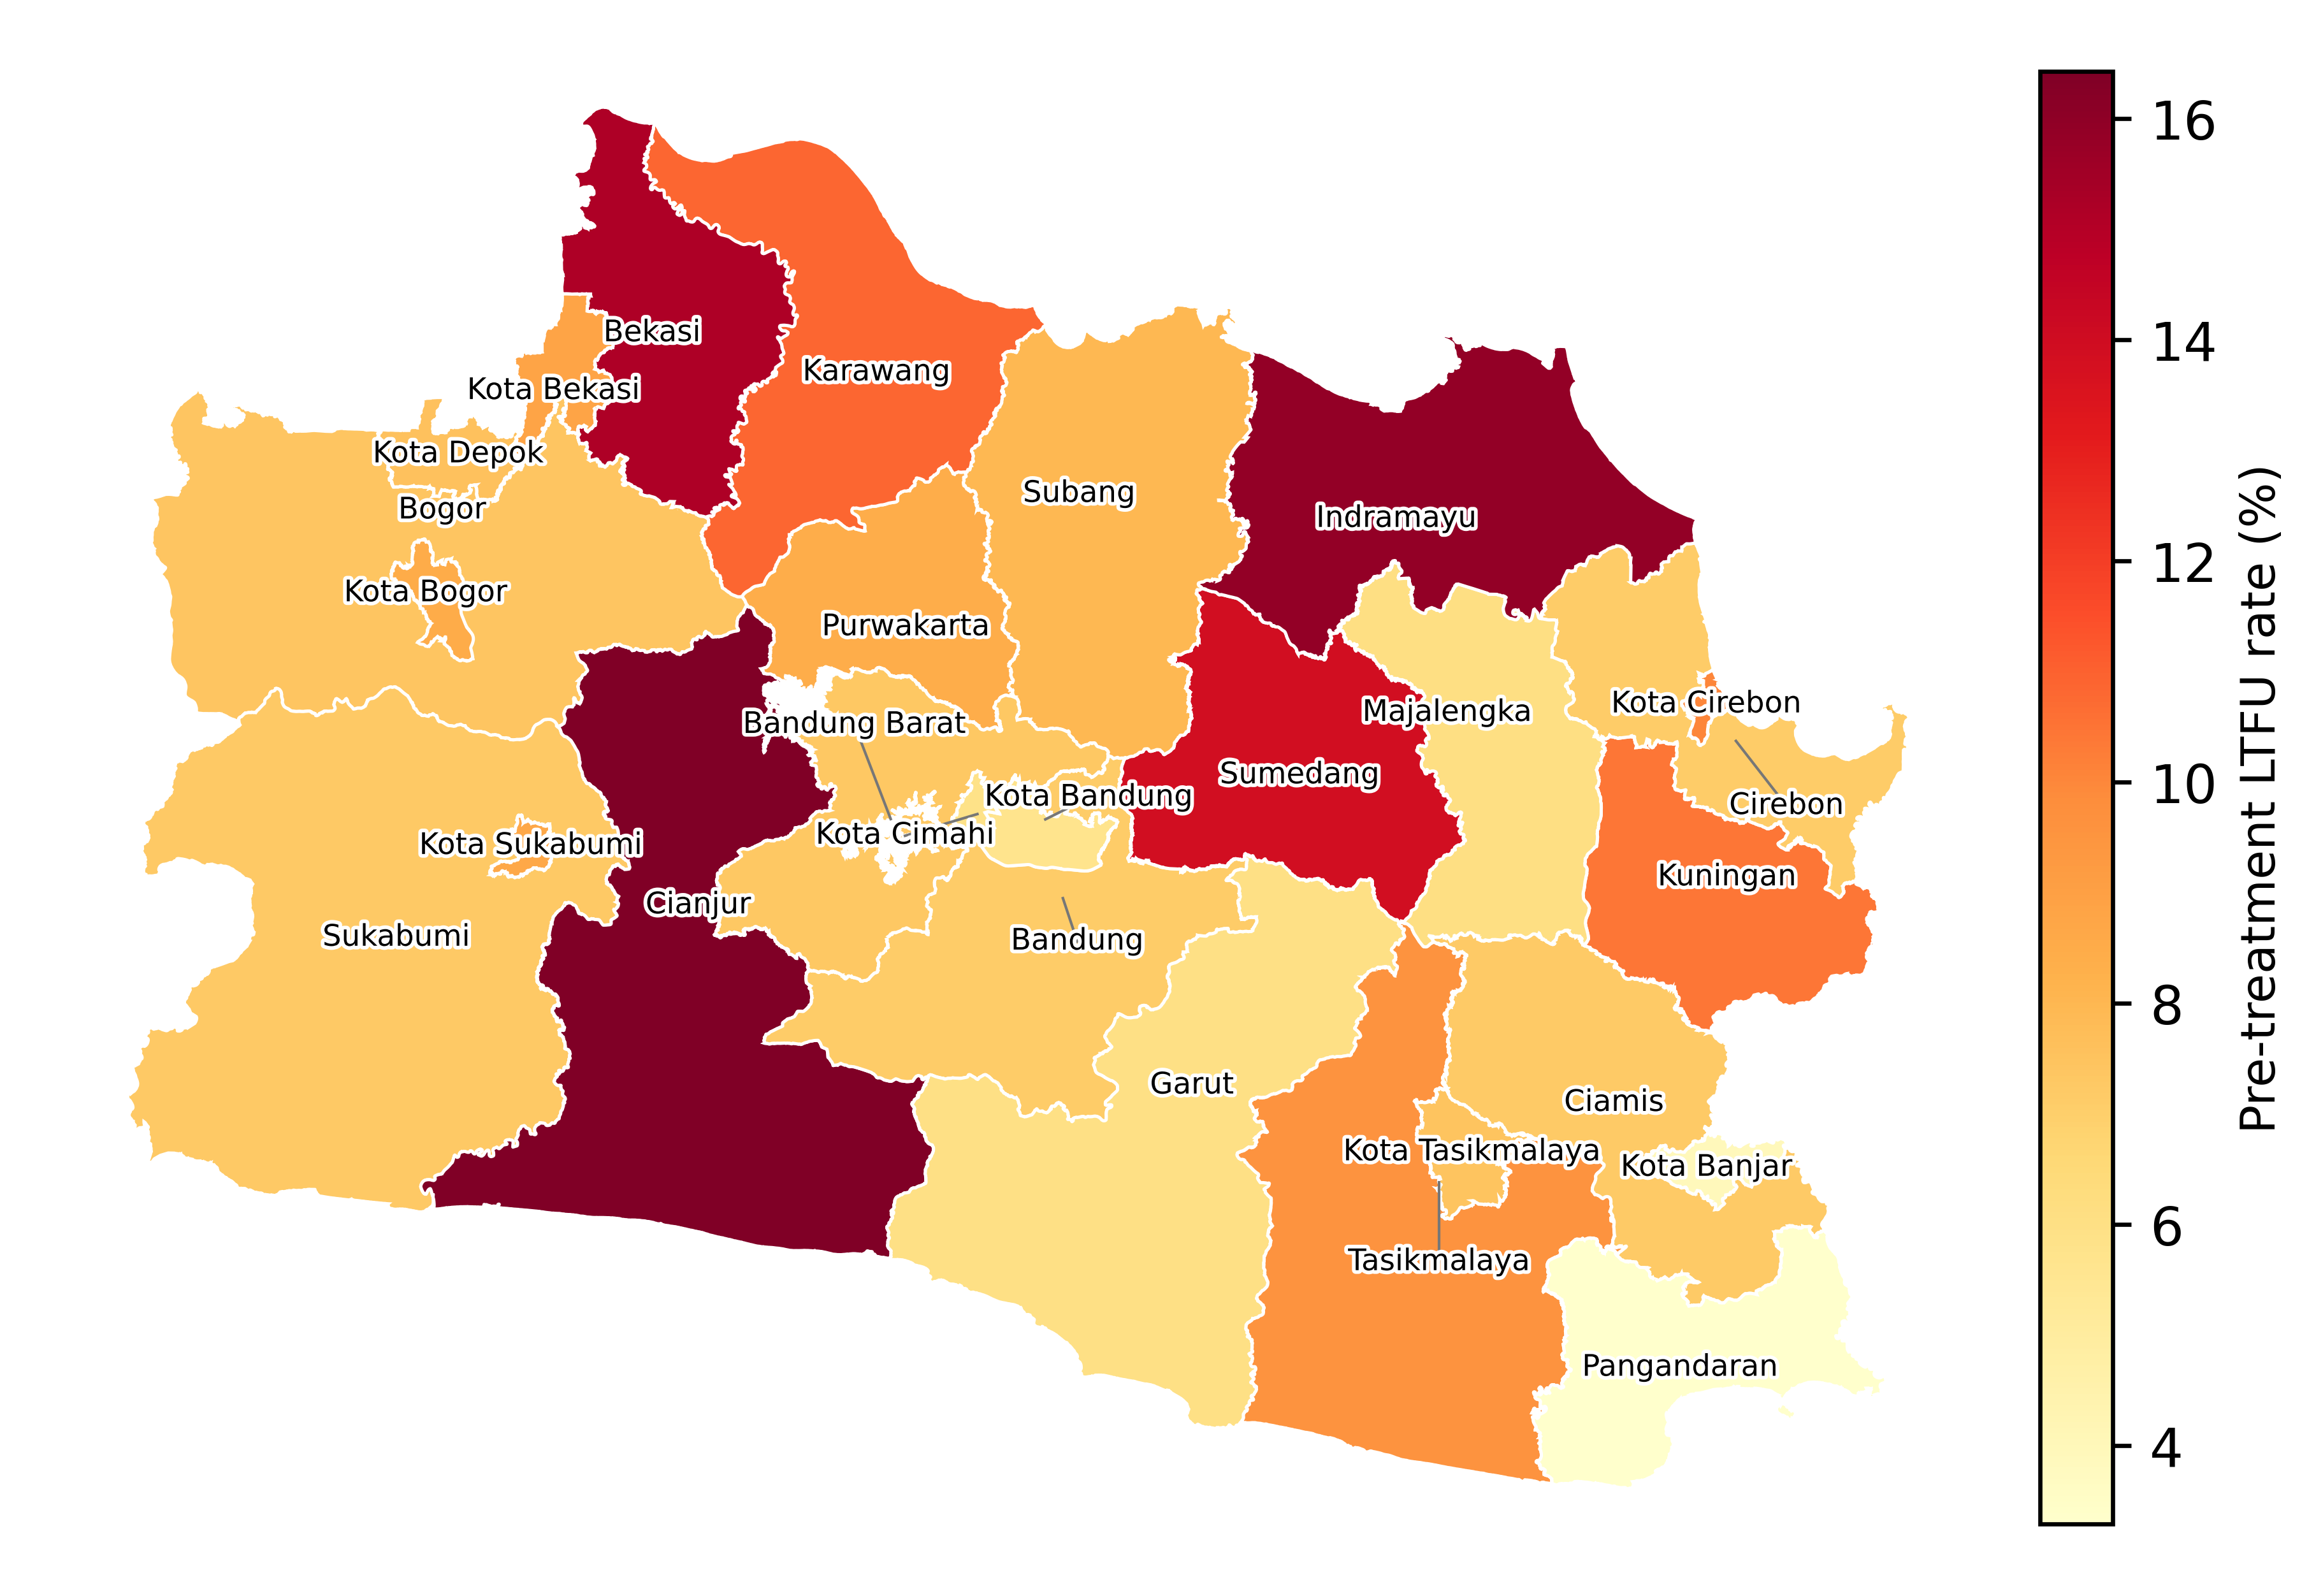
Map of the pre-treatment loss rate by district and city
Figure 1. Pre-treatment loss to follow-up rate by district and city.
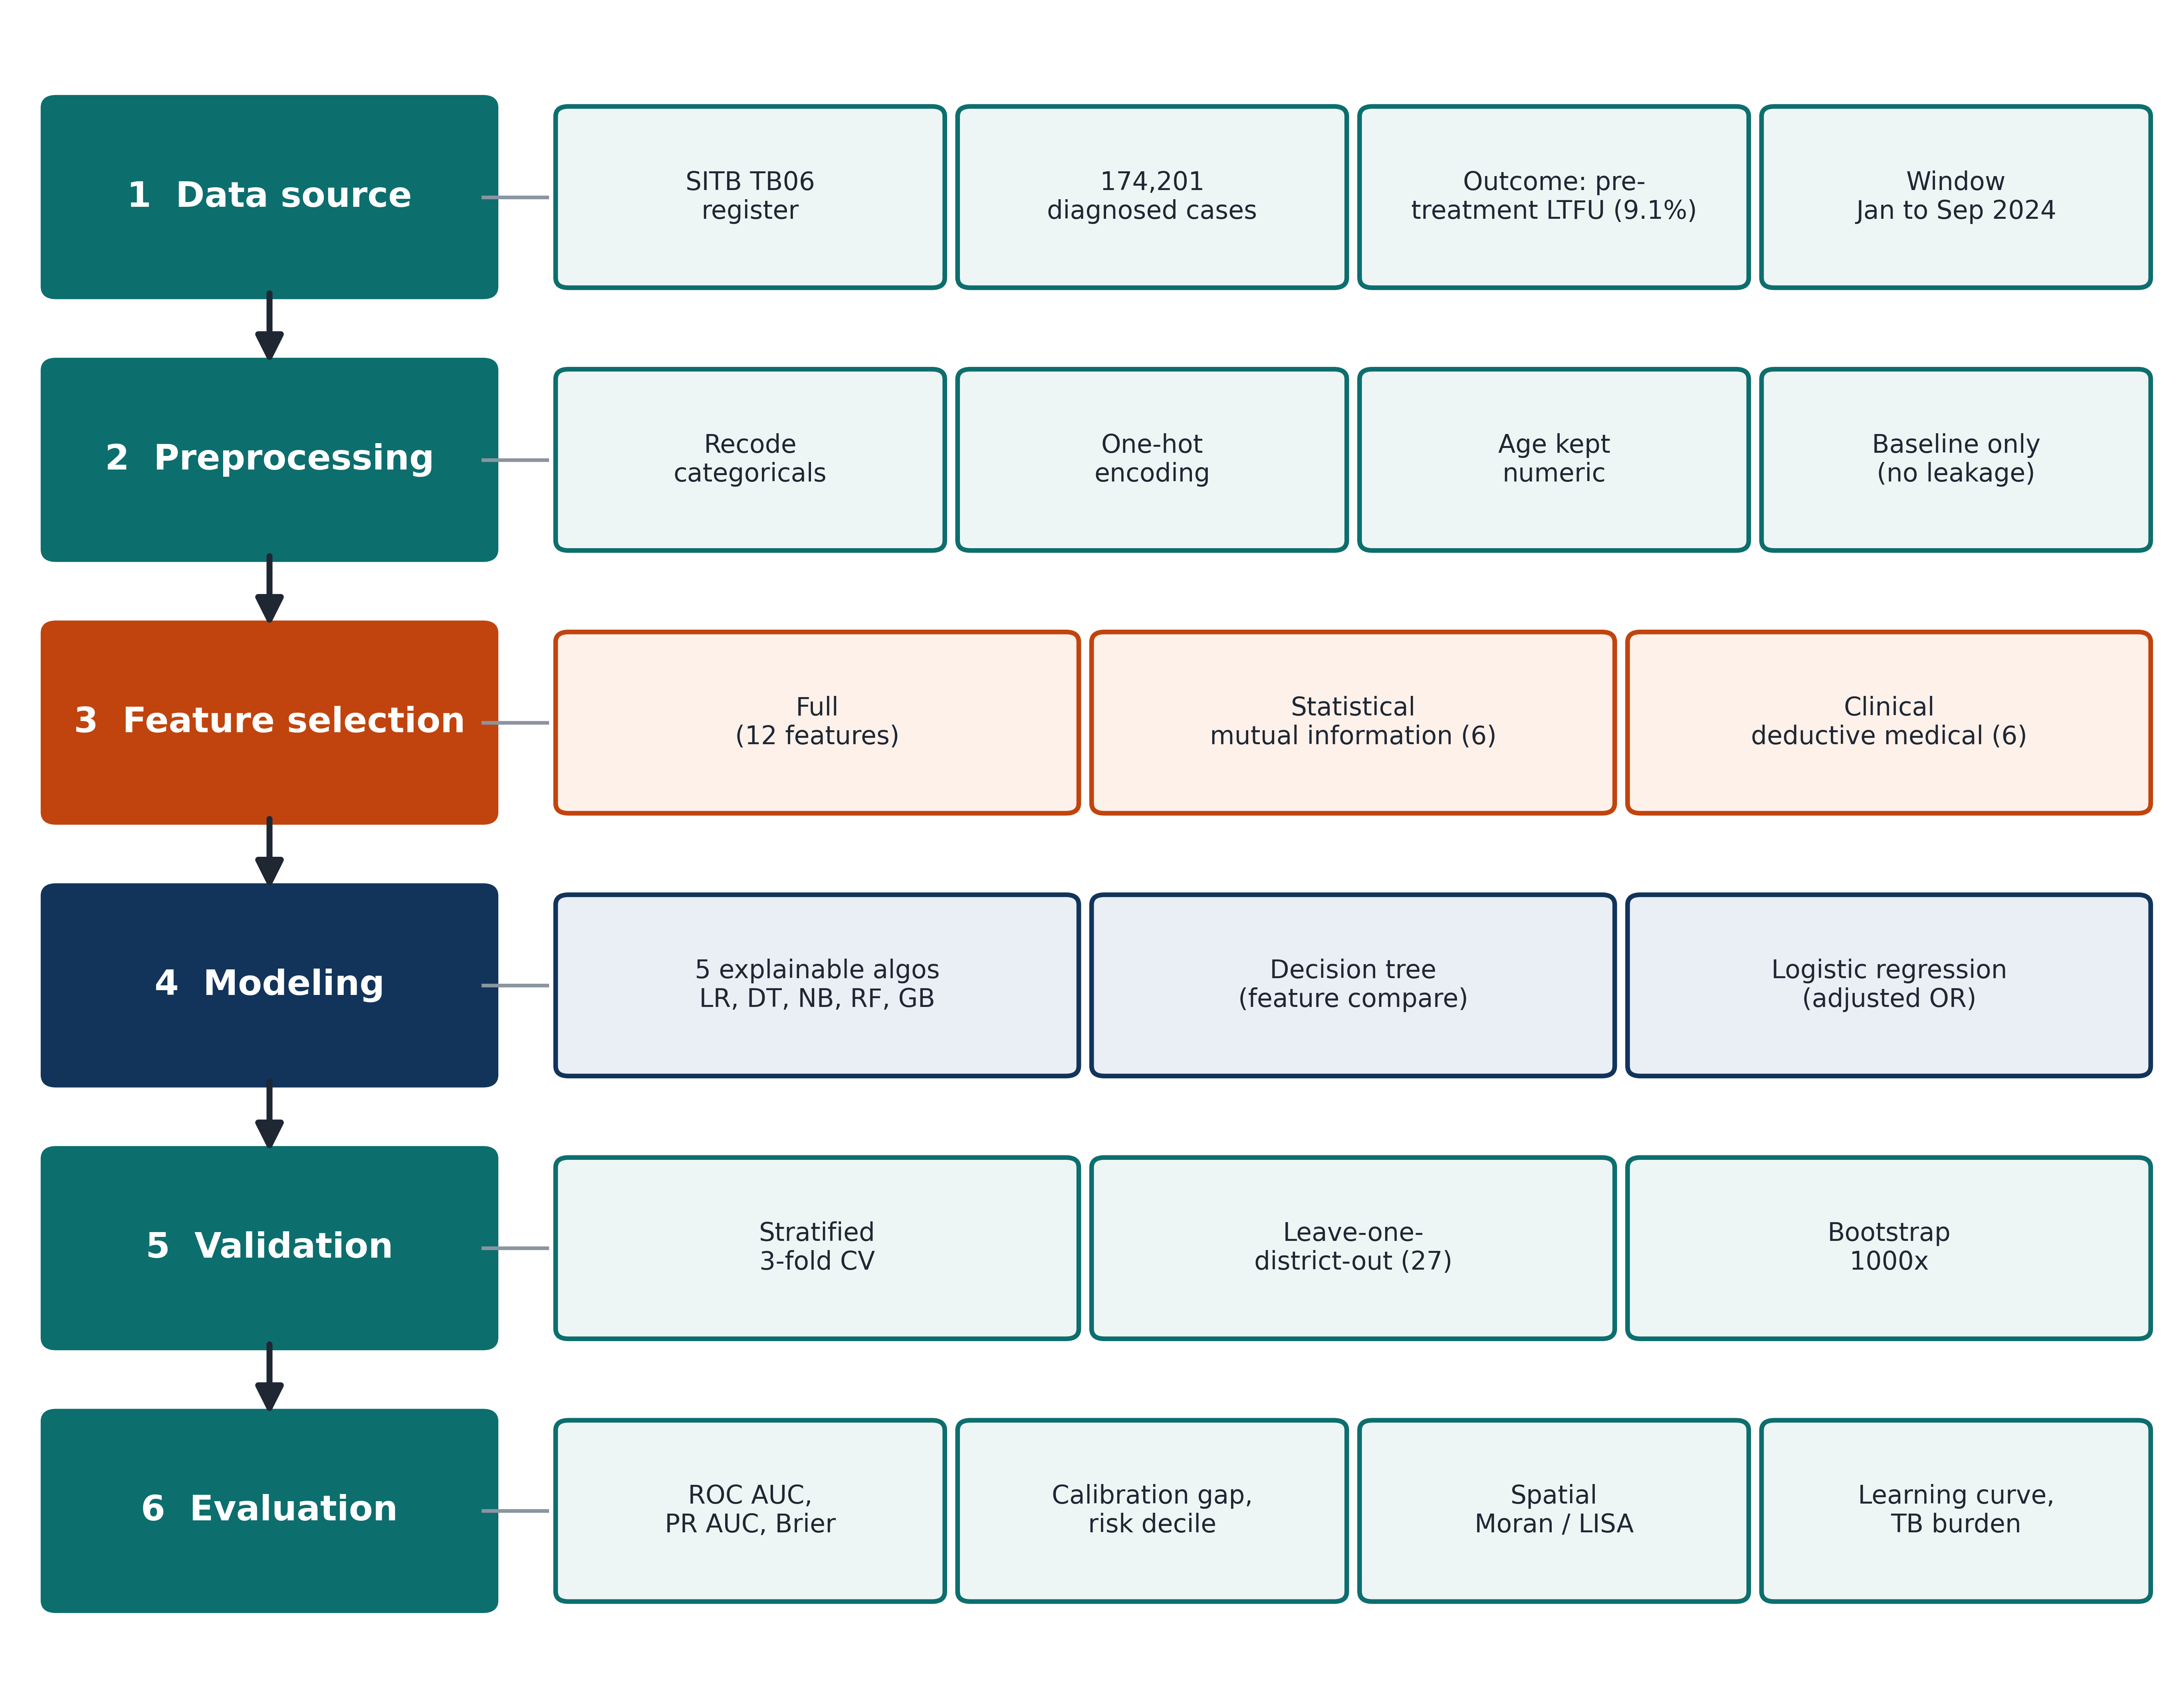
Study process flow, from data source to evaluation
Figure 2. Study process flow, from data source to evaluation.

Reproducibility

The full specification needed to reimplement the analysis. Every number shown on this page, including those behind each figure, is in the downloadable file.